Botswana's military expenditure saw marked increases in the late 1970s and 1980s, reaching 4.9% of GDP in 1988. This surge aligned with regional tensions in southern Africa during apartheid and conflicts involving neighboring states. Spending remained relatively high through the 1990s, averaging 3–4%, reflecting the continued modernization of Botswana's Defense Force.
From 2000 onward, expenditure trended lower, averaging around 3%, reflecting stability in the region and shifts toward social development. By 2022, military spending had declined to 2.7%, signifying a broader emphasis on economic growth and infrastructure over defense.
From 2000 onward, expenditure trended lower, averaging around 3%, reflecting stability in the region and shifts toward social development. By 2022, military spending had declined to 2.7%, signifying a broader emphasis on economic growth and infrastructure over defense.
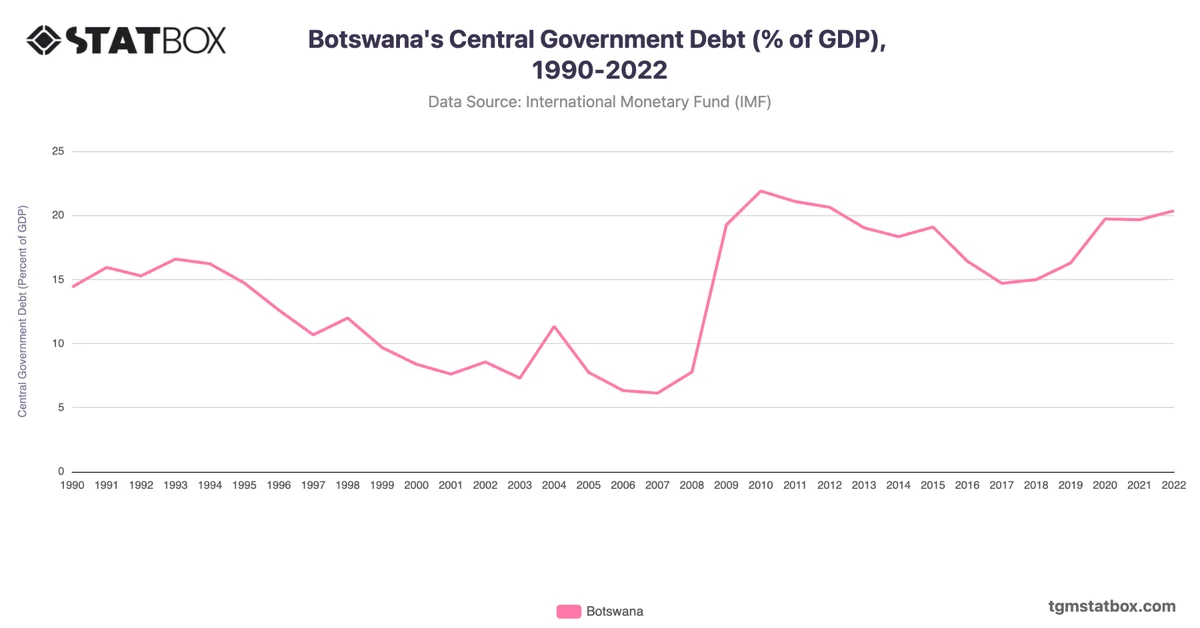
For additional information, visit statistics on Botswana’s import value, Botswana’s annual GDP figures, Botswana’s central government debt to GDP ratio.