Croatia's military expenditure was highest during the 1990s, peaking at 11.1% in 1994, reflecting the Croatian War of Independence and the subsequent need for defense restructuring. Post-conflict reductions were significant, with spending declining to 4.4% by 1999 as peace was restored.
By the early 2000s, expenditure settled around 1.7%, indicative of Croatia's transition to a peacetime economy and integration into NATO. A gradual rise to 2.2% in 2022 aligns with NATO defense requirements and regional security concerns.
By the early 2000s, expenditure settled around 1.7%, indicative of Croatia's transition to a peacetime economy and integration into NATO. A gradual rise to 2.2% in 2022 aligns with NATO defense requirements and regional security concerns.
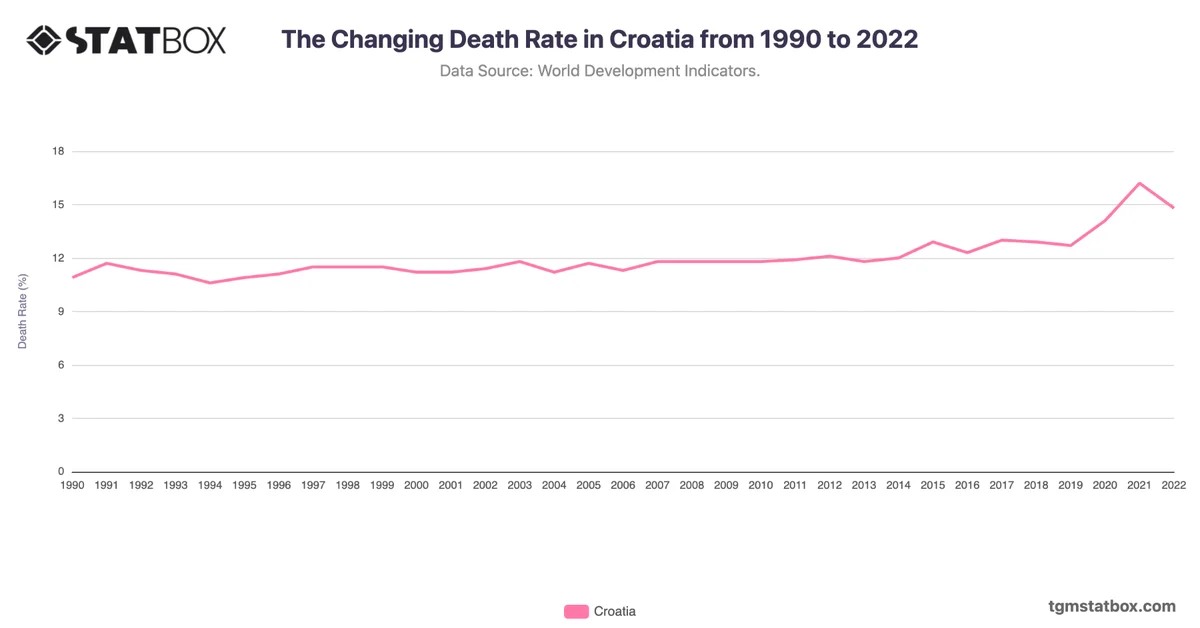
For a deeper dive into the topic, explore Croatia’s working-age population percentage trend, Croatia’s death rate fluctuations, Croatia’s population count.