Military expenditure in the United States has consistently remained one of the highest in the world, reflecting its global military commitments and defense policy priorities. In the 1960s and 1970s, defense spending was robust, with military expenditure hovering around 8-9% of GDP, especially during the Cold War. The Vietnam War and the Cold War arms race with the Soviet Union contributed to these high levels of expenditure. After a slight dip in the early 1970s, spending surged again in the 1980s under President Reagan’s military buildup, reaching a peak of 6.8% of GDP in 1982.
From the 1990s onwards, military expenditure saw a general decline as the Cold War ended and the U.S. focused on domestic issues. However, the attacks on September 11, 2001, and the subsequent War on Terror led to a significant spike in defense spending, which remained elevated throughout the 2000s and 2010s, peaking at 4.9% of GDP in the early 2000s. By 2020, defense spending stabilized at about 3.7%, reflecting the U.S.'s ongoing military commitments and its shifting global priorities. In recent years, military expenditure has remained steady at 3.5% in 2021-2022, continuing the trend of prioritizing defense while navigating global challenges like the rise of China and regional instability.
From the 1990s onwards, military expenditure saw a general decline as the Cold War ended and the U.S. focused on domestic issues. However, the attacks on September 11, 2001, and the subsequent War on Terror led to a significant spike in defense spending, which remained elevated throughout the 2000s and 2010s, peaking at 4.9% of GDP in the early 2000s. By 2020, defense spending stabilized at about 3.7%, reflecting the U.S.'s ongoing military commitments and its shifting global priorities. In recent years, military expenditure has remained steady at 3.5% in 2021-2022, continuing the trend of prioritizing defense while navigating global challenges like the rise of China and regional instability.
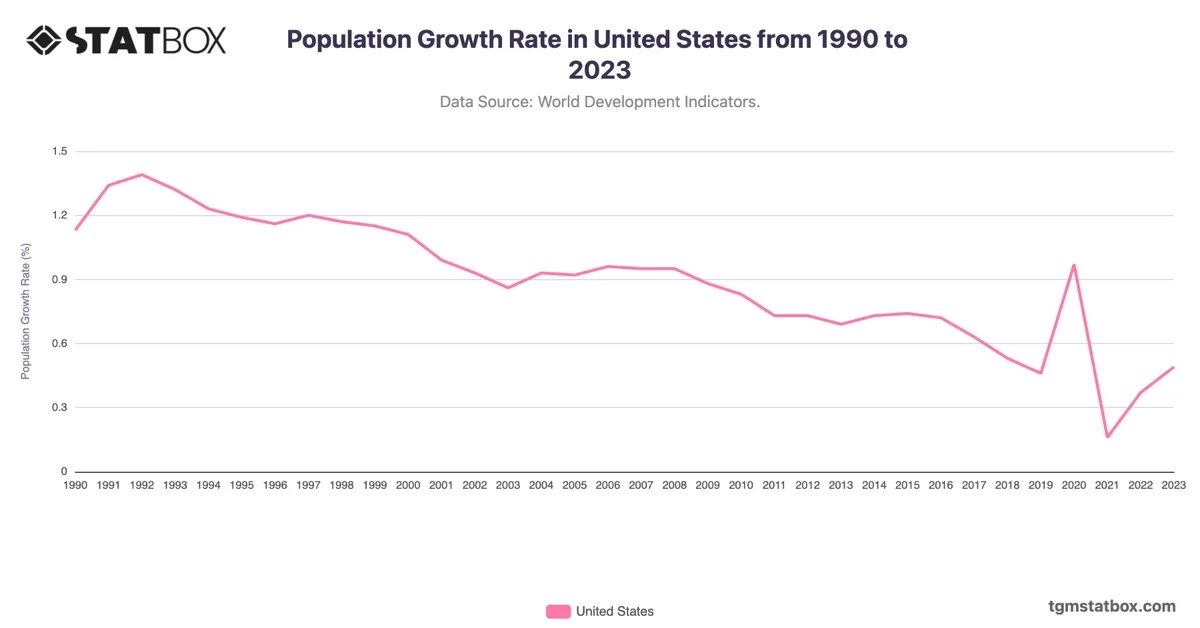
For a broader context, visit other statistics on US population growth rate, Service sector’s share in US GDP, United States military personnel proportion.