The United States experienced significant growth in import values, rising from $517B in 1990 to a record $3.37T in 2022. The 1990s saw consistent growth, with imports nearly doubling from $603B in 1993 to $1.05T in 1999, reflecting expanding globalization and consumer demand. The early 2000s saw a further surge, reaching $2.02T by 2007, driven by strong domestic consumption and increased reliance on global supply chains.
The 2008 financial crisis caused a sharp decline to $1.61T in 2009, but recovery was swift, with imports peaking at $3.37T in 2022. The slight decline to $3.17T in 2023 reflects adjustments in global trade dynamics and economic conditions. The U.S. remains a dominant player in global trade, with imports driven by consumer goods, technology, and energy products.
The 2008 financial crisis caused a sharp decline to $1.61T in 2009, but recovery was swift, with imports peaking at $3.37T in 2022. The slight decline to $3.17T in 2023 reflects adjustments in global trade dynamics and economic conditions. The U.S. remains a dominant player in global trade, with imports driven by consumer goods, technology, and energy products.
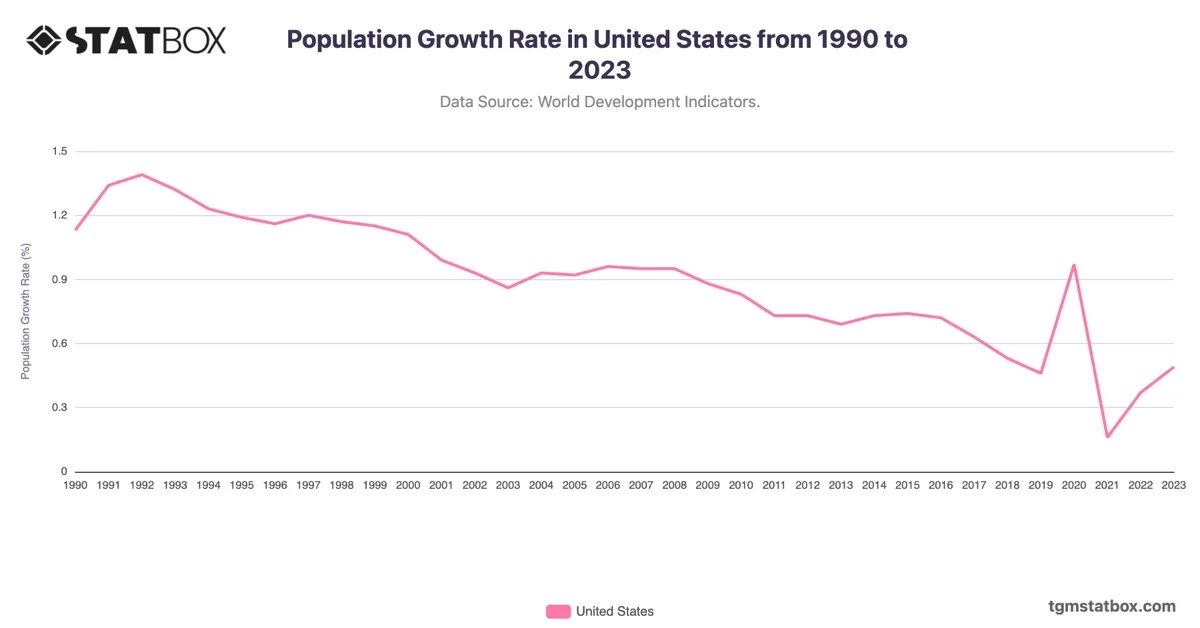
Explore related charts to gain a better understanding of United States’ goods export value, United States’ population figures, US population growth rate.