Chart

Services Sector Contribution to GDP in United States (1990-2022)

Services Sector Contribution to GDP in United States (1990-2022)

Share the statistic on social media channels or embed the statistic in your website using "Embed Code", where available.

Share chart

Embed chart
Select Citation

Cite this statistic and select one of the following formats: APA, Chicago, Harvard, MLA & Bluebook


  • APA
  • Chicago
  • Harvard
  • MLA
  • Bluebook
  • IEEE
TGM StatBox. (2024). Services Sector Contribution to GDP in United States (1990-2022). TGM StatBox.
Insights

Key Takeaways

The United States has consistently maintained a high services sector contribution to GDP, reflecting its advanced, service-oriented economy. In 1997, services contributed 71.8% to GDP, and by 2000, this figure rose to 72.8%, with a slight uptick during the tech boom era. The early 2000s saw the sector’s contribution fluctuate slightly, peaking in 2009 at 76.5% during the global financial crisis, when manufacturing and other sectors faced significant downturns. Post-2009, the services sector remained a primary economic driver, stabilizing around 76% to 77% as the U.S. economy recovered. In 2020, amid the COVID-19 pandemic, services peaked again at 78.1% due to increased digitalization, healthcare, and financial services activity, with slight dips following as the economy adjusted post-pandemic. This consistent rise underscores the U.S. economy's reliance on services such as finance, healthcare, and information technology, reflecting both domestic demand and global competitiveness in these sectors.

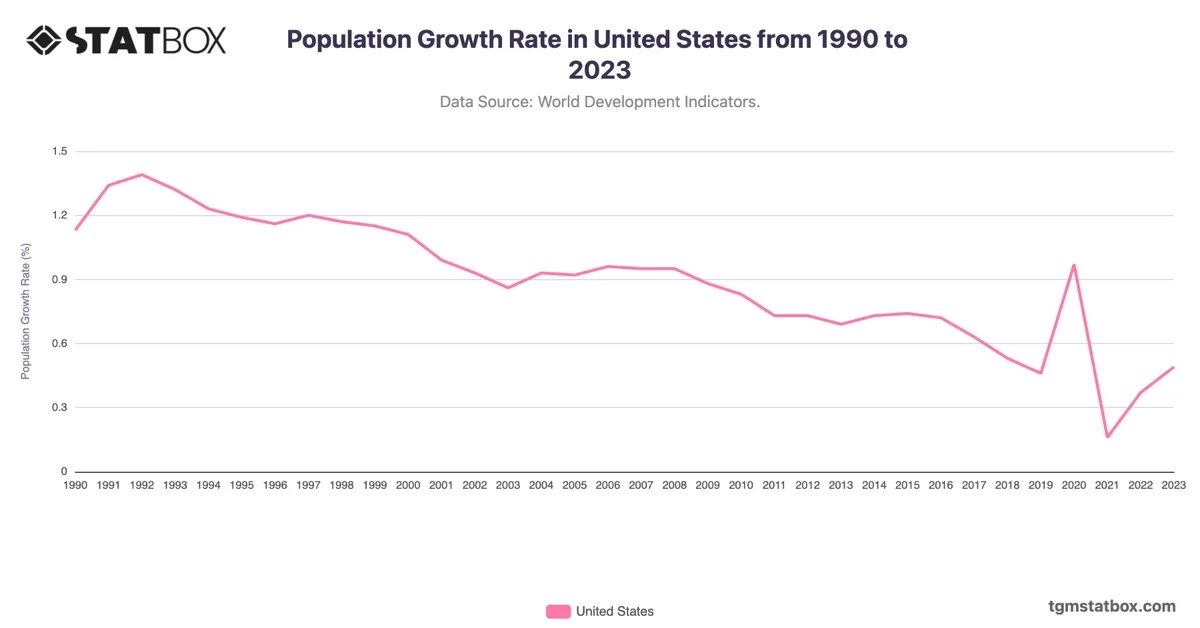
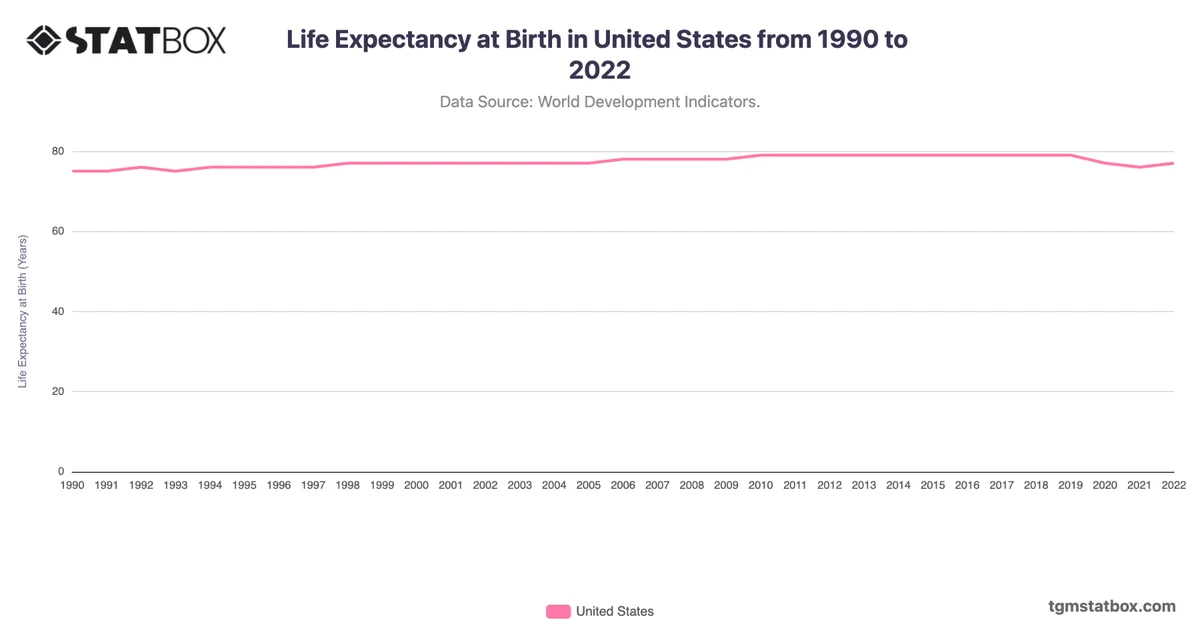
Explore related charts to gain a better understanding of Industry sector’s share in US GDP, United States annual GDP growth rate, US life span estimate.

AI-powered chart insight: This summary is automatically generated to help you understand the chart at a glance. It is intended as an overview; view the full chart and underlying data for complete context.

Related report

Would You Like to Know More?
Explore Our USA Report

Charts library

Further Recommended USA Statistics

Statbox vector
The briefing
New data, in your inbox

Consumer insights, data stories and product updates as we publish them. No other mail, and one click to leave.

Roughly two emails a month.

Research services
Have a question our newsroom hasn't answered? Ask it directly.

Our team can run the study behind the story — in 60+ countries, on your question, with the data belonging to you.