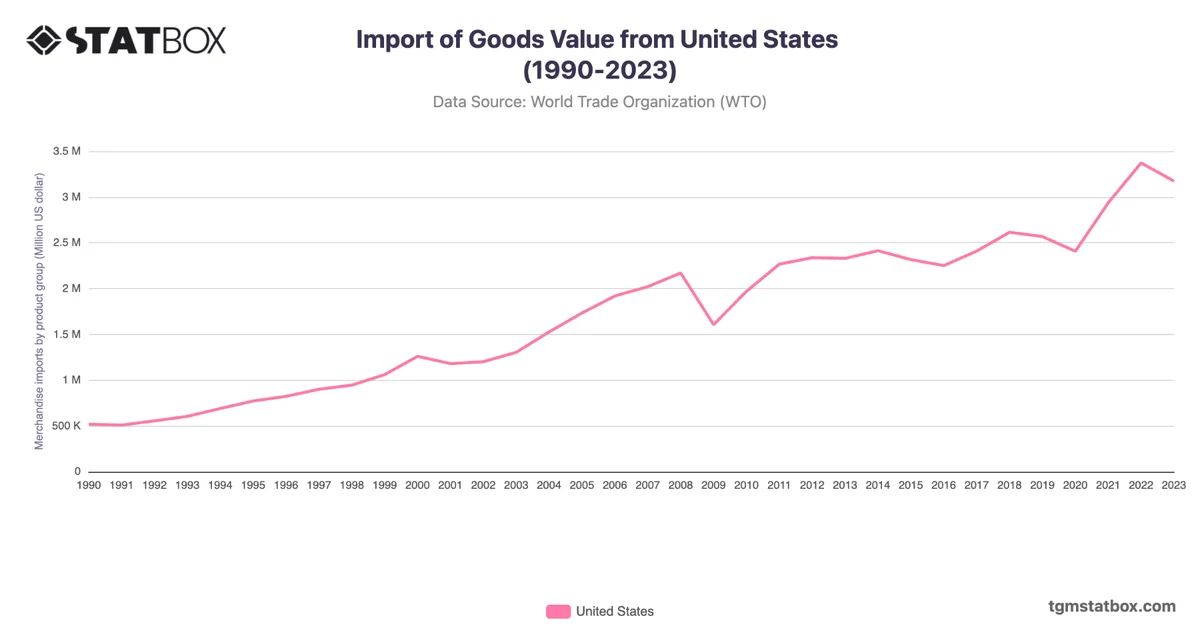
The United States has consistently been one of the largest exporters globally, with its export of goods value growing from $393.6 billion in 1990 to $2.02 trillion in 2023. The 1990s and early 2000s saw steady growth, particularly in technology, machinery, and agricultural products, which bolstered exports. In 2000, exports reached $781 billion, marking the beginning of a period of expansive trade growth. The years following saw continued robust growth, reaching a peak of $1.29 trillion in 2008, driven by the global demand for U.S. products.
The 2008 financial crisis caused a significant contraction in exports, which fell to $1.06 trillion in 2009. However, the U.S. export sector rebounded quickly, fueled by recovery in sectors such as aerospace and chemicals. By 2018, exports had surged to $1.66 trillion, aided by international trade agreements and a strong U.S. dollar. The impact of the COVID-19 pandemic saw a slight dip in exports to $1.42 trillion in 2020. Nevertheless, the U.S. export of goods value rebounded strongly in the following years, reaching new highs, culminating in $2.06 trillion in 2022. The 2023 value of $2.02 trillion reflects the resilience of the U.S. export market, driven by strong global demand and the country's diversified export portfolio.
The 2008 financial crisis caused a significant contraction in exports, which fell to $1.06 trillion in 2009. However, the U.S. export sector rebounded quickly, fueled by recovery in sectors such as aerospace and chemicals. By 2018, exports had surged to $1.66 trillion, aided by international trade agreements and a strong U.S. dollar. The impact of the COVID-19 pandemic saw a slight dip in exports to $1.42 trillion in 2020. Nevertheless, the U.S. export of goods value rebounded strongly in the following years, reaching new highs, culminating in $2.06 trillion in 2022. The 2023 value of $2.02 trillion reflects the resilience of the U.S. export market, driven by strong global demand and the country's diversified export portfolio.
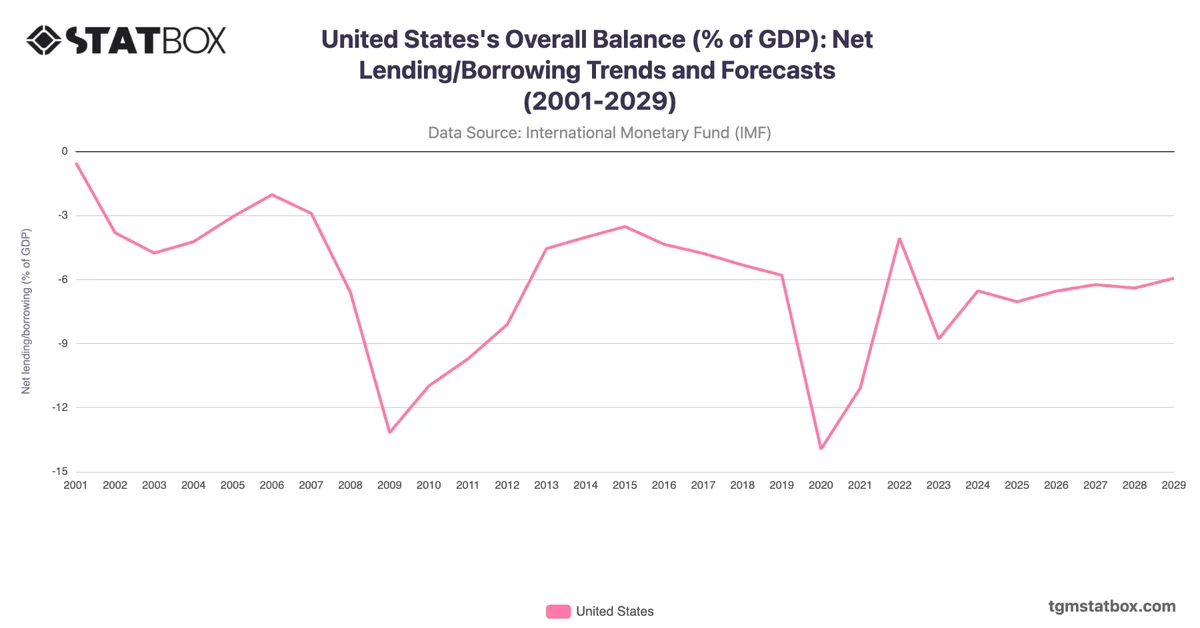
For additional information, visit statistics on United States unemployment rate, US net financial position as a percentage of GDP, Service sector’s share in US GDP.