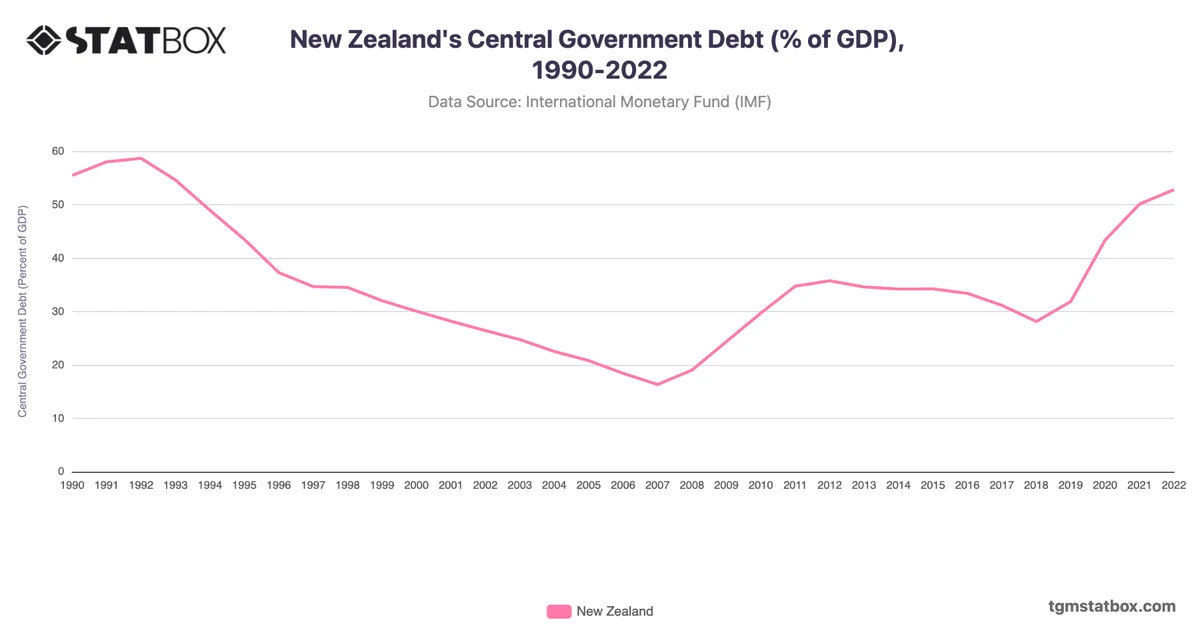
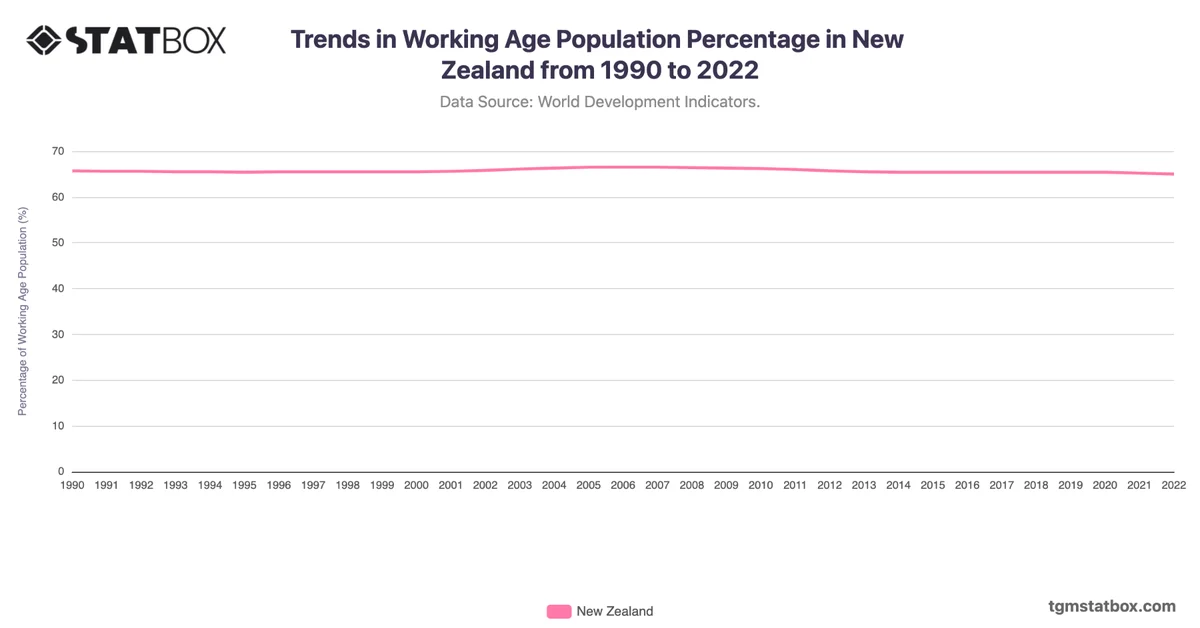
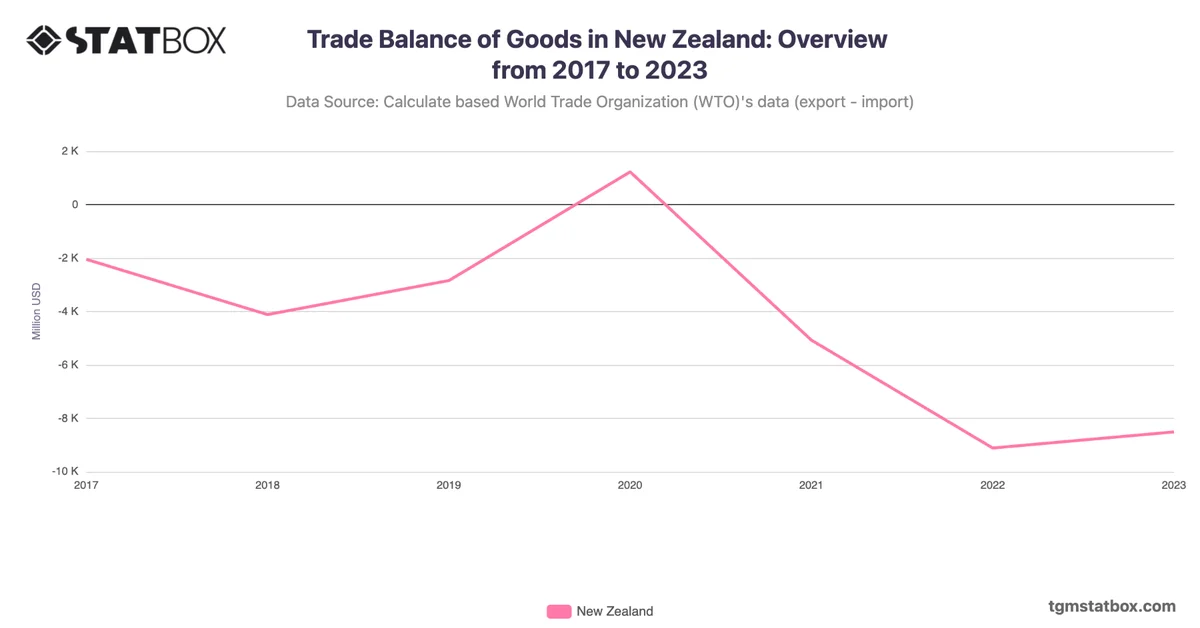
New Zealand experienced elevated unemployment rates in the early 1990s, peaking at 10.7% in 1992 due to structural economic changes and global recessionary pressures. By the mid-90s, government reforms and economic growth helped reduce unemployment to around 6% by 1996. The rate continued to improve, reaching a historic low of 3.7% in 2007 before the global financial crisis drove it back up to 6.6% in 2010, as New Zealand’s economy was impacted by reduced global demand.
In the years following, New Zealand’s unemployment rate slowly declined as the economy recovered, with the rate dropping to 4.1% in 2019. The pandemic saw a brief rise to 4.6% in 2020, but New Zealand’s swift economic recovery measures helped the rate decrease to 3.3% by 2022. By 2023, unemployment was at 3.7%, demonstrating a stable labor market response amid global challenges.
In the years following, New Zealand’s unemployment rate slowly declined as the economy recovered, with the rate dropping to 4.1% in 2019. The pandemic saw a brief rise to 4.6% in 2020, but New Zealand’s swift economic recovery measures helped the rate decrease to 3.3% by 2022. By 2023, unemployment was at 3.7%, demonstrating a stable labor market response amid global challenges.
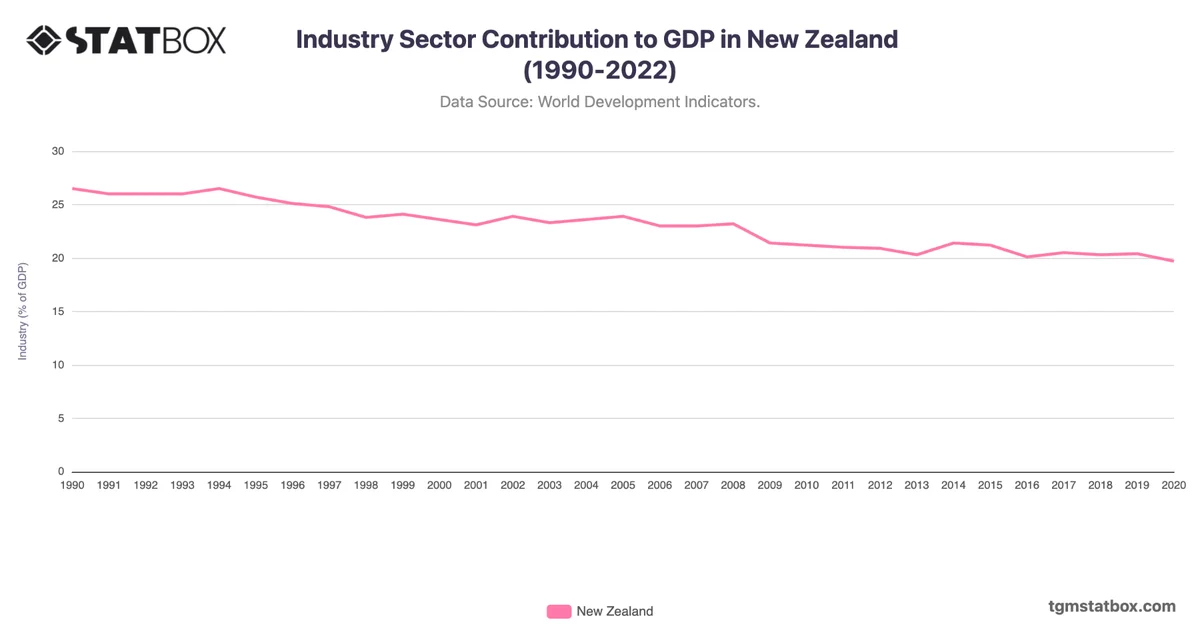
For a broader context, visit other statistics on Military personnel share in New Zealand, New Zealand’s yearly GDP growth rate, New Zealand’s sectoral contribution to GDP.