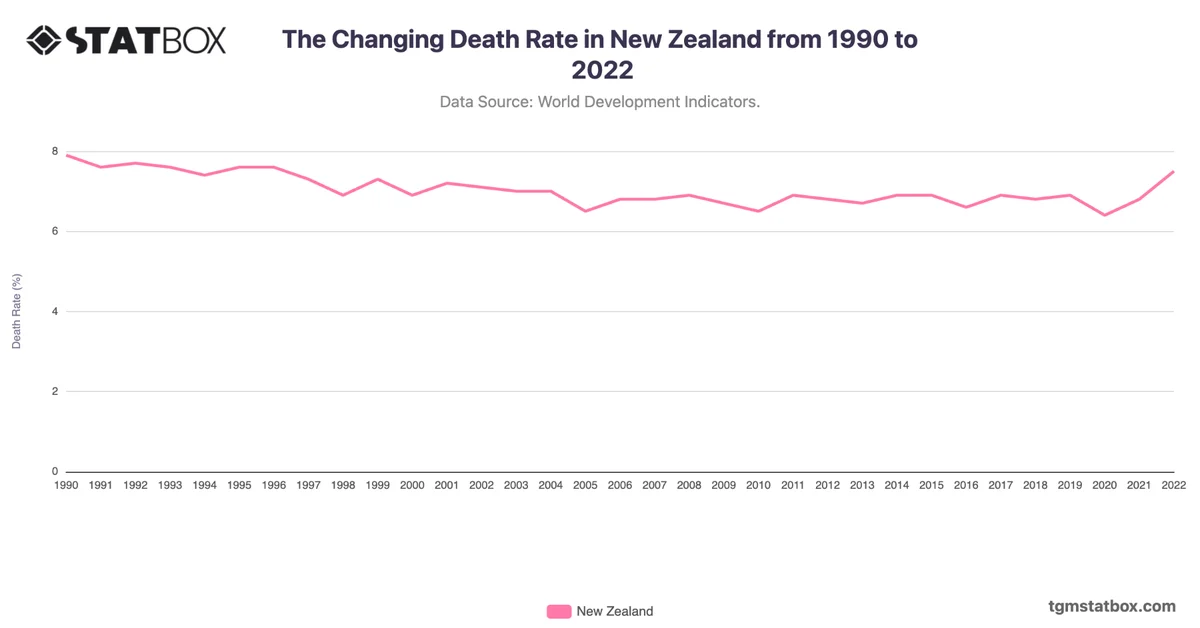
New Zealand's mortality rate steadily declined from 9.2 in 1990 to 3.9 in 2022, reflecting advancements in healthcare and public health policies. By 2000, the rate had decreased to 6.1, driven by improved maternal and neonatal care, alongside widespread access to quality healthcare services.
Post-2000, the decline continued gradually, with the rate reaching 4.0 by 2020. Factors such as increased emphasis on preventive care, better management of chronic diseases, and equitable healthcare access contributed to these gains. New Zealand’s consistent reductions highlight its strong public health infrastructure, though challenges related to aging populations remain.
Post-2000, the decline continued gradually, with the rate reaching 4.0 by 2020. Factors such as increased emphasis on preventive care, better management of chronic diseases, and equitable healthcare access contributed to these gains. New Zealand’s consistent reductions highlight its strong public health infrastructure, though challenges related to aging populations remain.
Gain a broader perspective by reviewing Agriculture’s share in New Zealand’s GDP, New Zealand’s birth longevity, New Zealand’s population density.