Pakistan's fertility rate declined from 6.4 in 1990 to 3.4 in 2022, showcasing significant progress over three decades. The sharp drop during the 1990s and early 2000s—from 6.4 to 5.1—can be attributed to increased awareness of family planning, expanded healthcare infrastructure, and investments in women's education.
The downward trend continued into the 2010s, with the rate falling to 3.4 by 2022. This reduction highlights the impact of government and non-governmental initiatives aimed at promoting smaller family sizes and reproductive health. However, challenges persist, particularly in rural areas, where cultural norms and limited access to resources slow the pace of change.
The downward trend continued into the 2010s, with the rate falling to 3.4 by 2022. This reduction highlights the impact of government and non-governmental initiatives aimed at promoting smaller family sizes and reproductive health. However, challenges persist, particularly in rural areas, where cultural norms and limited access to resources slow the pace of change.
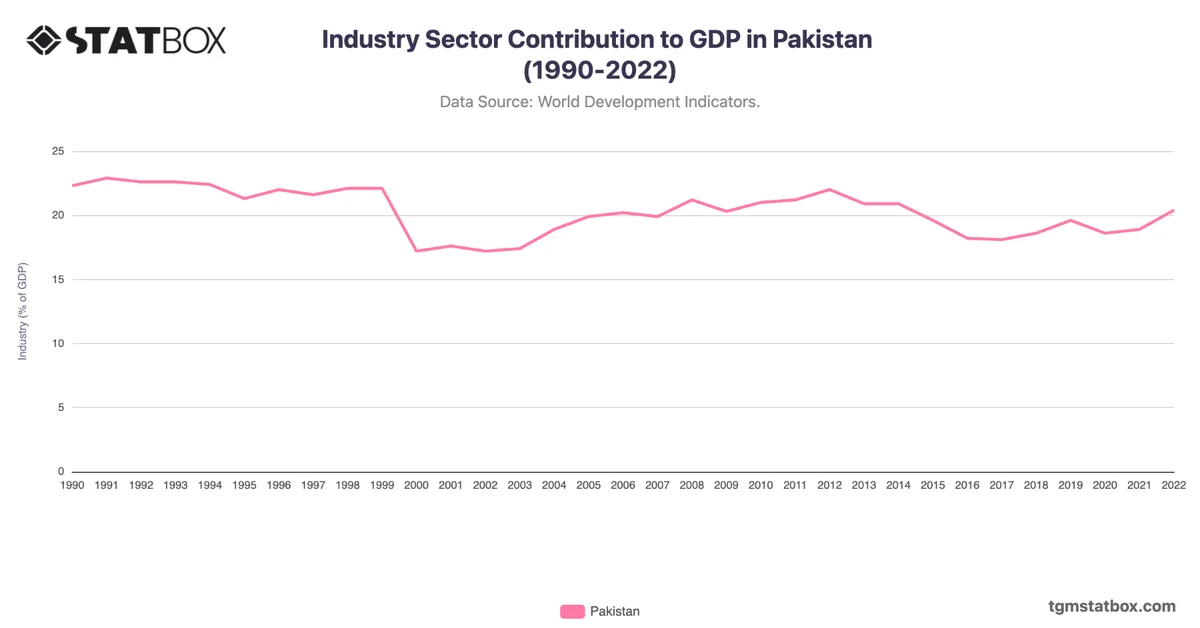
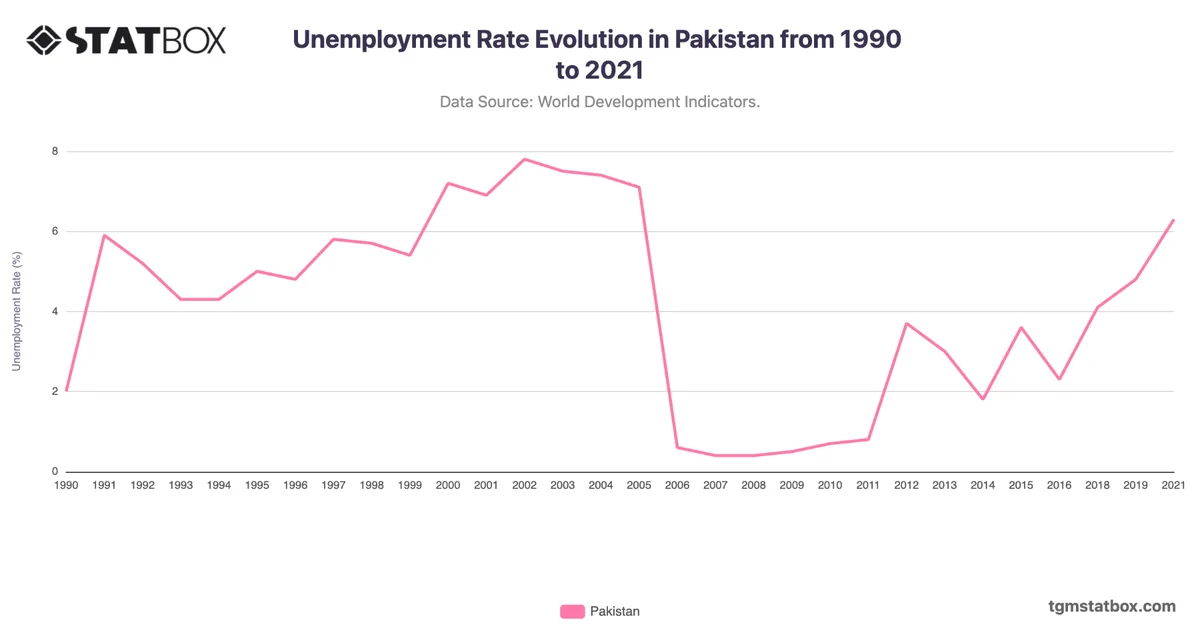
Gain a broader perspective by reviewing Pakistan’s manufacturing sector share in GDP, Pakistan’s population density, Pakistan’s unemployment rate.