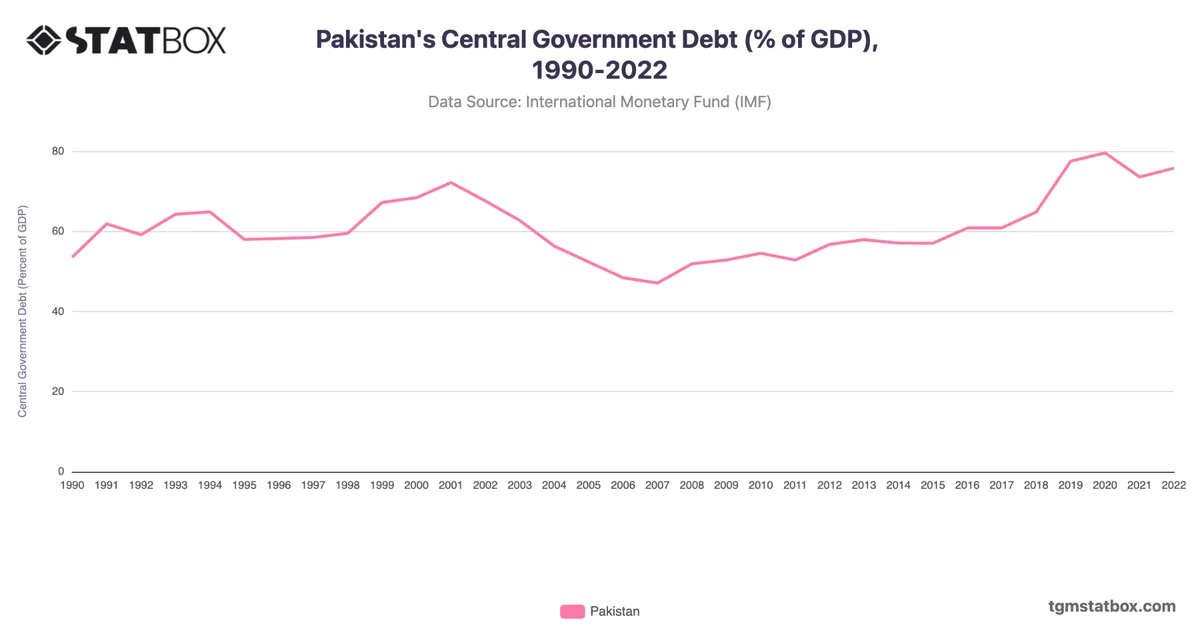
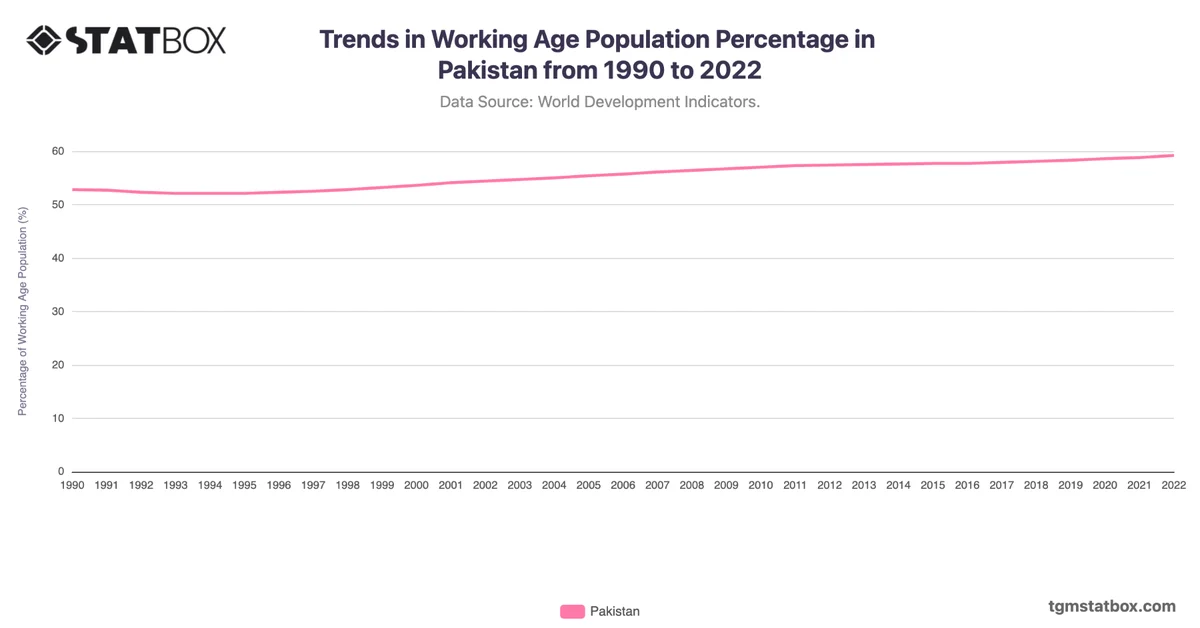
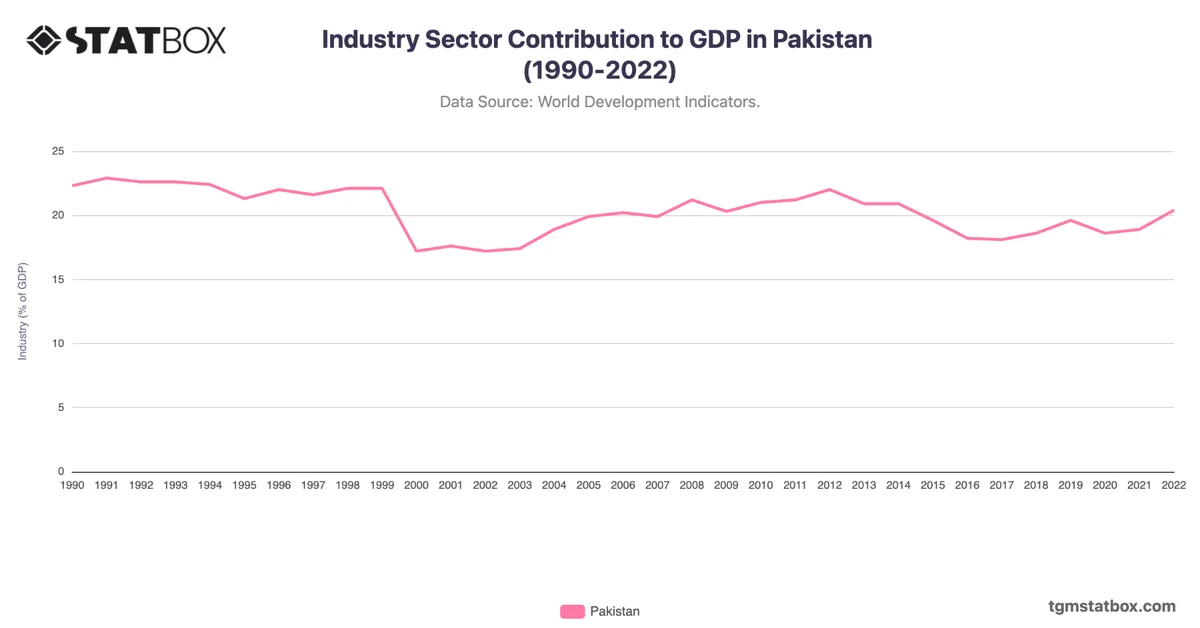
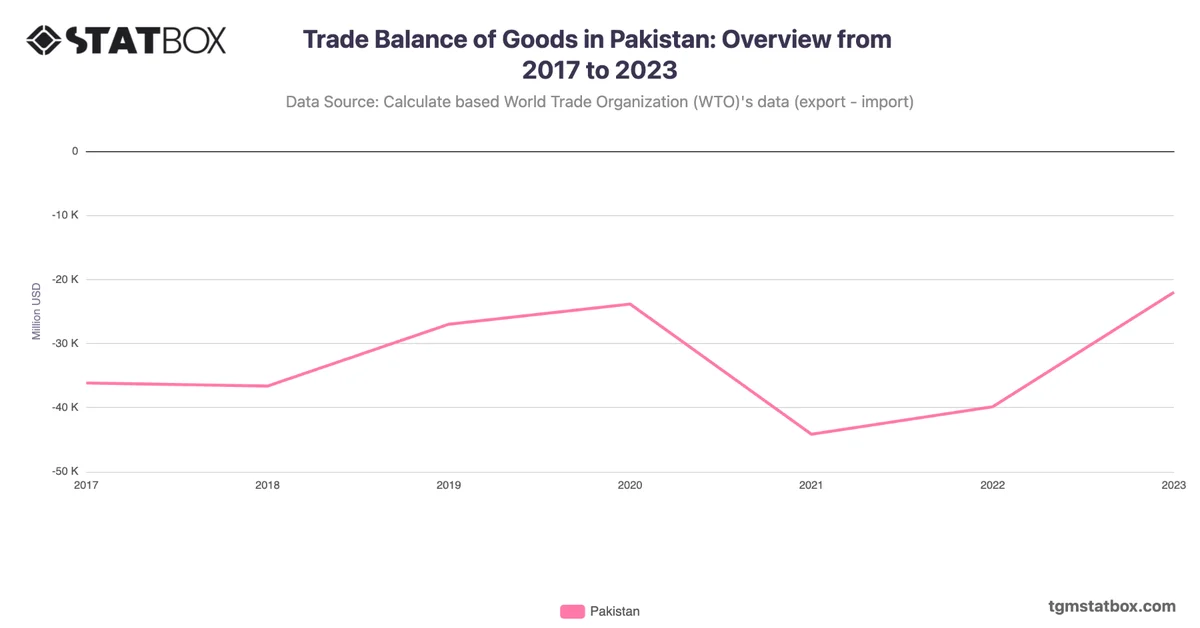
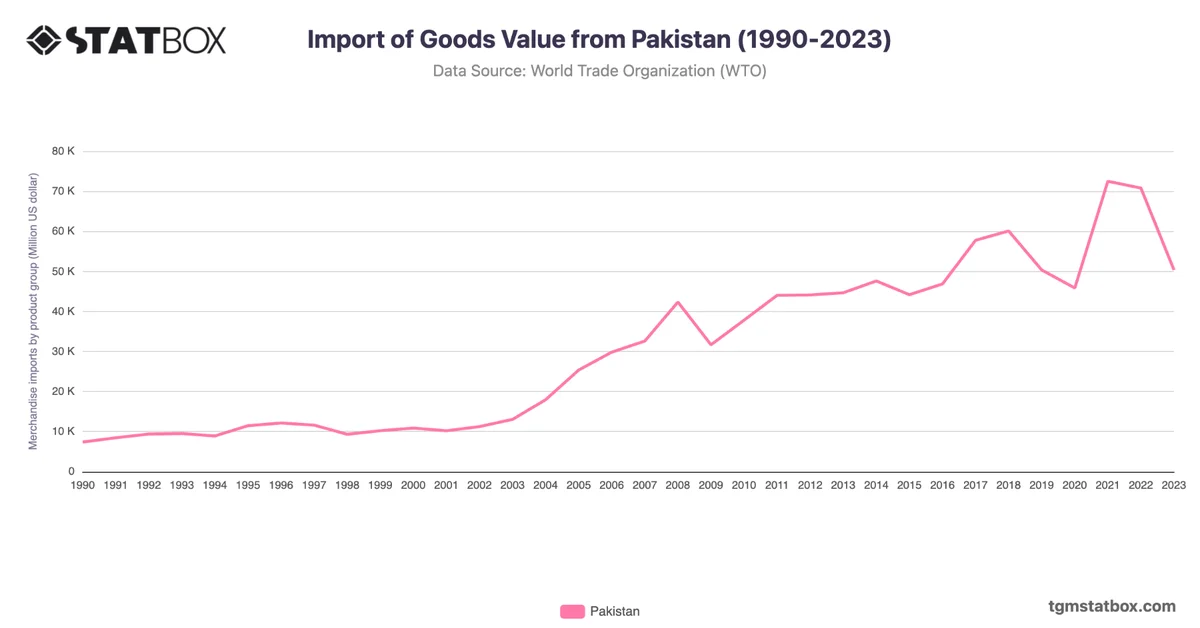
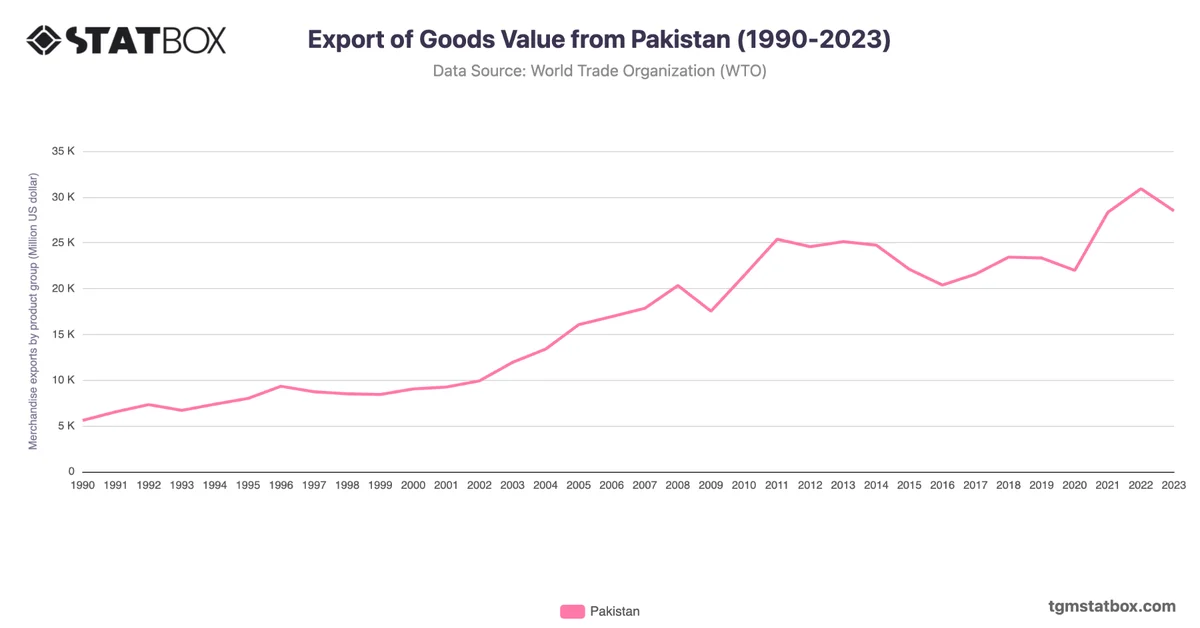
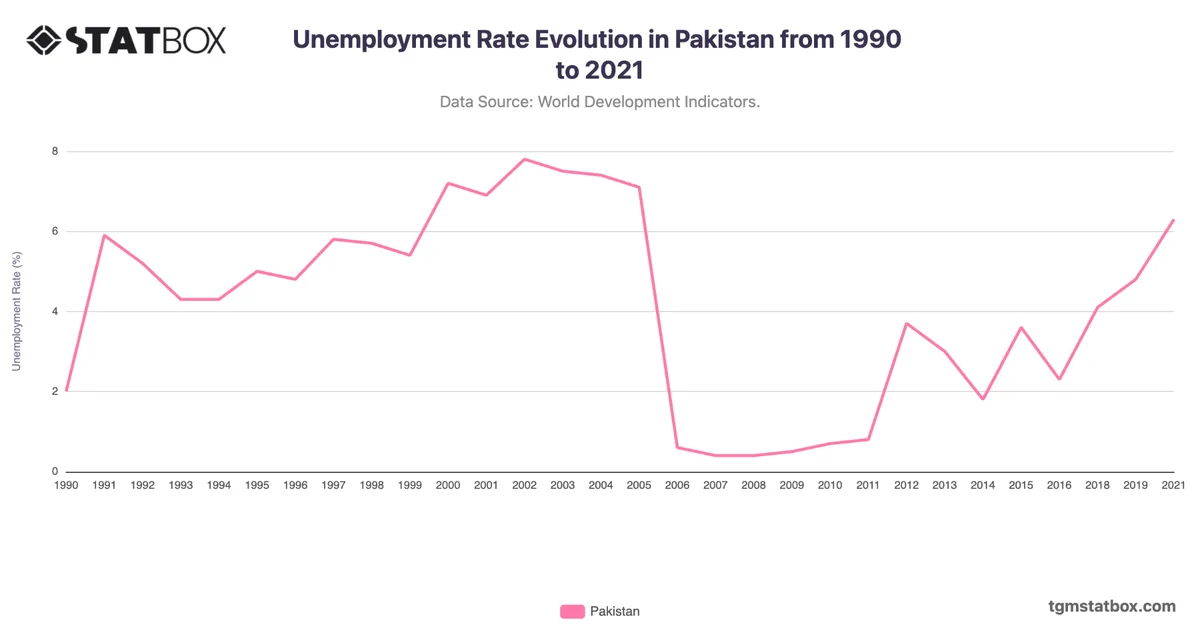
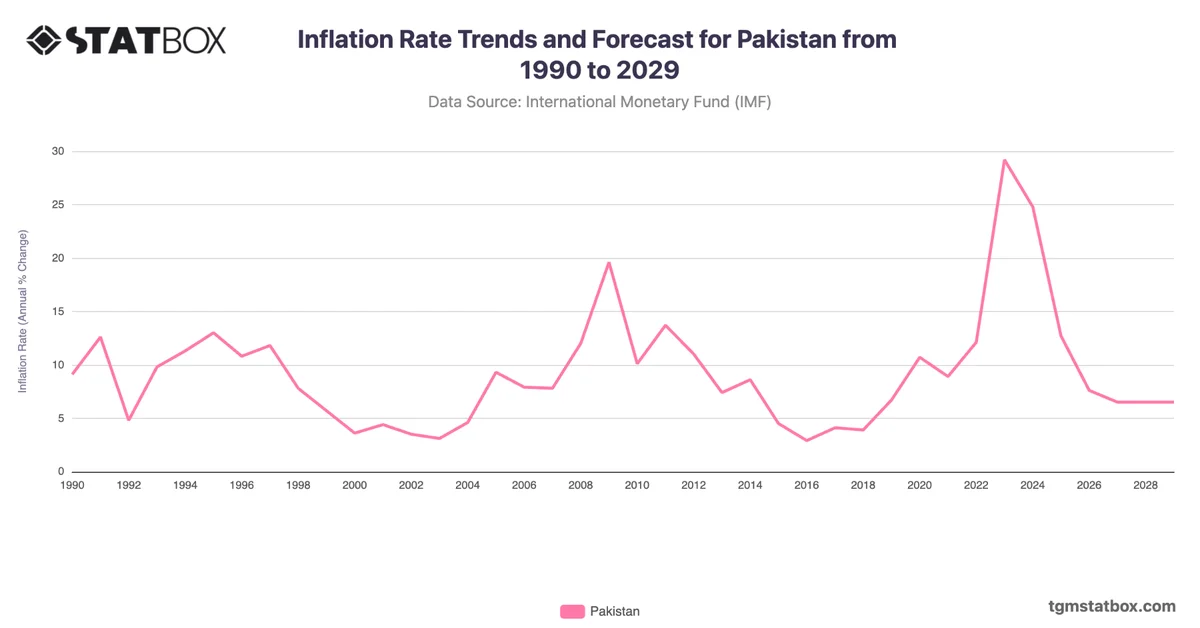
Pakistan's GDP growth reflects periods of steady expansion interspersed with economic challenges. From $4.1 billion in 1961, GDP grew to $23.6 billion in 1980, driven by agricultural and industrial development. The 1980s and 1990s saw moderate growth, with GDP reaching $63.3 billion in 1996. However, political instability and external debt slowed progress during this period.
Economic reforms and improved trade policies in the 2000s spurred growth, with GDP peaking at $374.7 billion in 2022. While global shocks like the COVID-19 pandemic affected the economy, Pakistan’s resilience stems from remittances, agriculture, and textile exports.
Economic reforms and improved trade policies in the 2000s spurred growth, with GDP peaking at $374.7 billion in 2022. While global shocks like the COVID-19 pandemic affected the economy, Pakistan’s resilience stems from remittances, agriculture, and textile exports.
Gain a broader perspective by reviewing Pakistan’s export value, Pakistan’s annual GDP growth rate, Pakistan’s agriculture share in GDP.