Pakistan's Net ODA (% of GNI) has shown significant fluctuations, peaking at 2.6% in 1991 as international aid supported economic reforms and infrastructure development. Aid levels dropped sharply by the mid-1990s, reflecting political instability and changes in donor priorities. However, a resurgence in 2001-2002, reaching 2.0%, coincided with Pakistan's alignment with global counterterrorism efforts post-9/11.
Spikes in 2010 (1.5%) and 2011 (1.6%) were linked to aid for disaster recovery, particularly following the devastating floods. Aid levels have steadily declined in recent years, stabilizing at 0.5%-0.9% by 2022, reflecting reduced donor reliance as Pakistan works toward economic self-sufficiency amid ongoing challenges.
Spikes in 2010 (1.5%) and 2011 (1.6%) were linked to aid for disaster recovery, particularly following the devastating floods. Aid levels have steadily declined in recent years, stabilizing at 0.5%-0.9% by 2022, reflecting reduced donor reliance as Pakistan works toward economic self-sufficiency amid ongoing challenges.
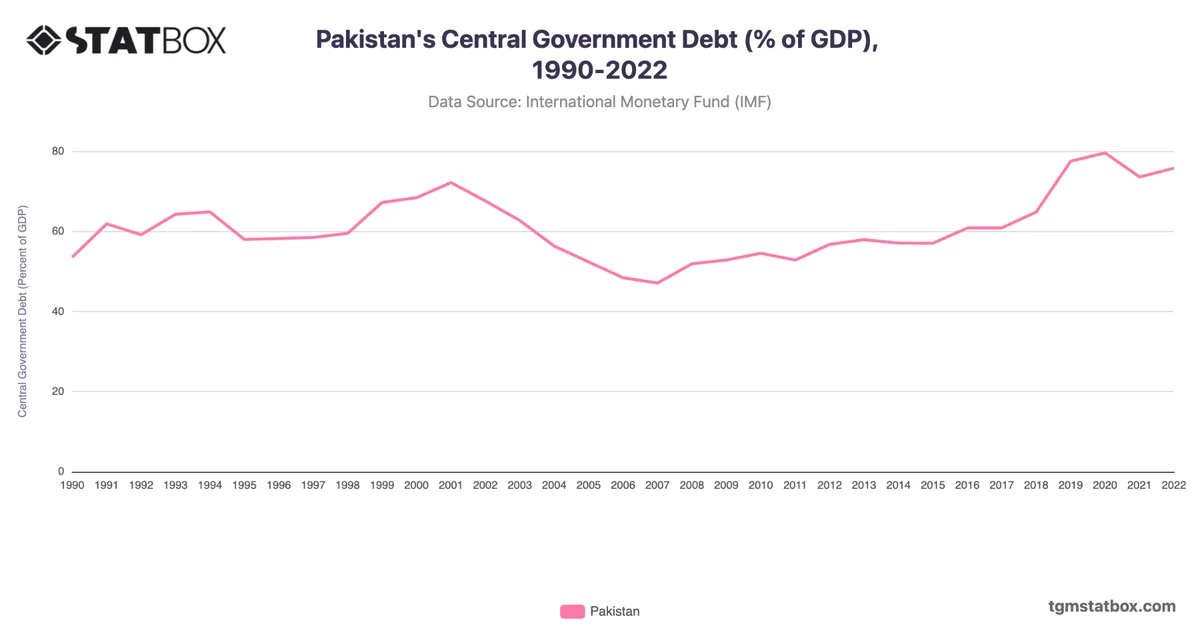
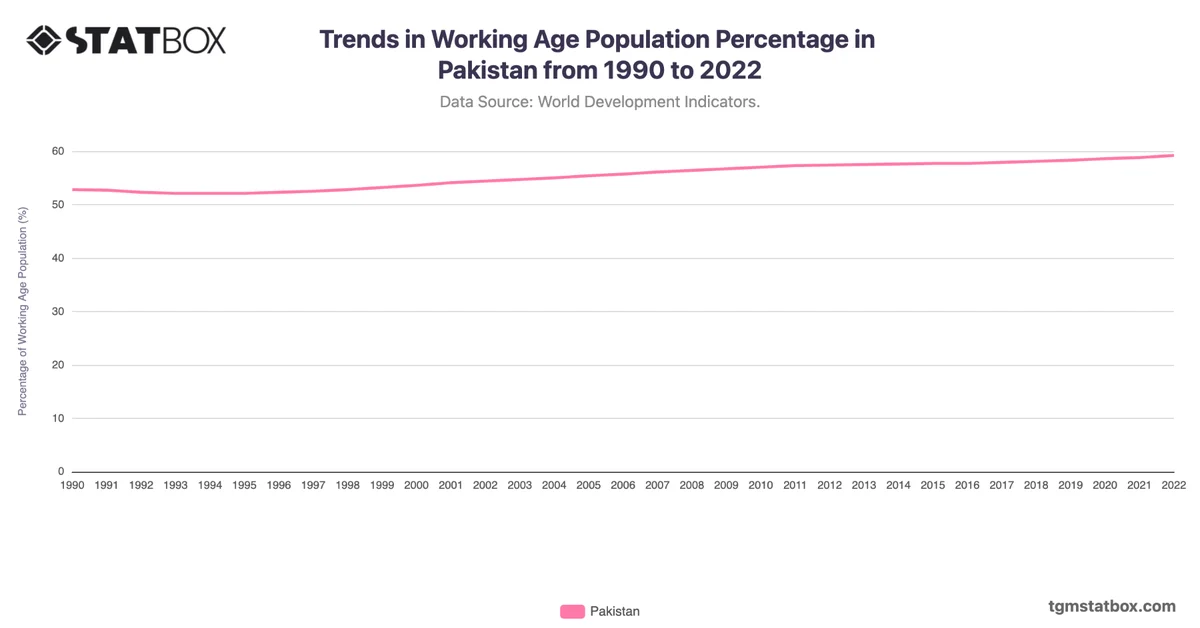
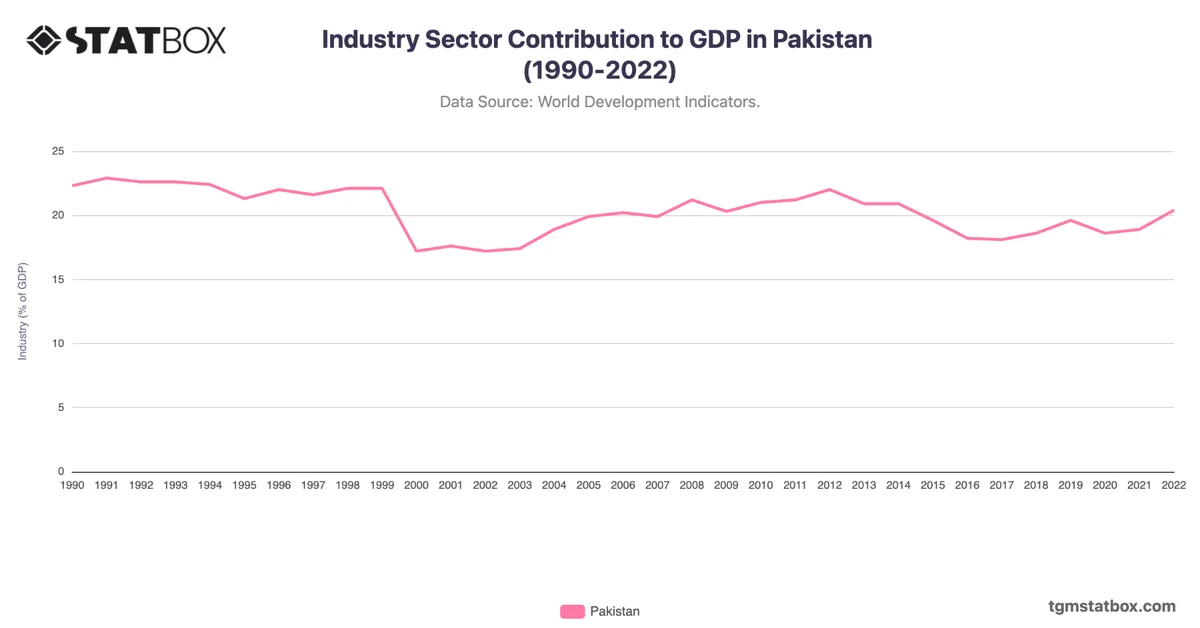
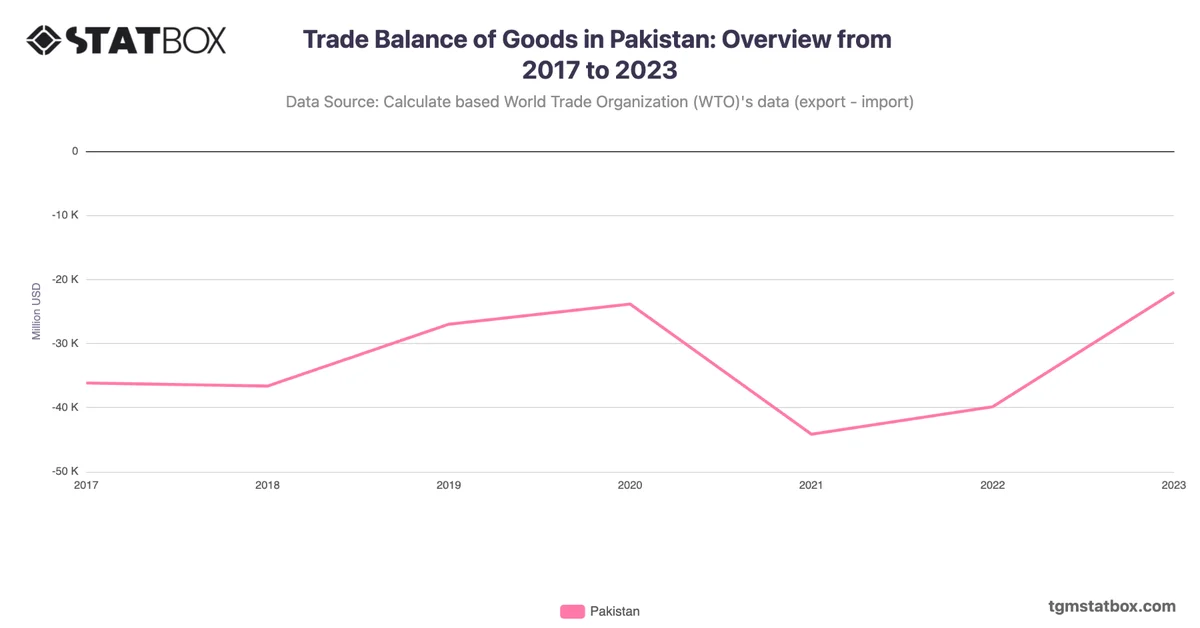
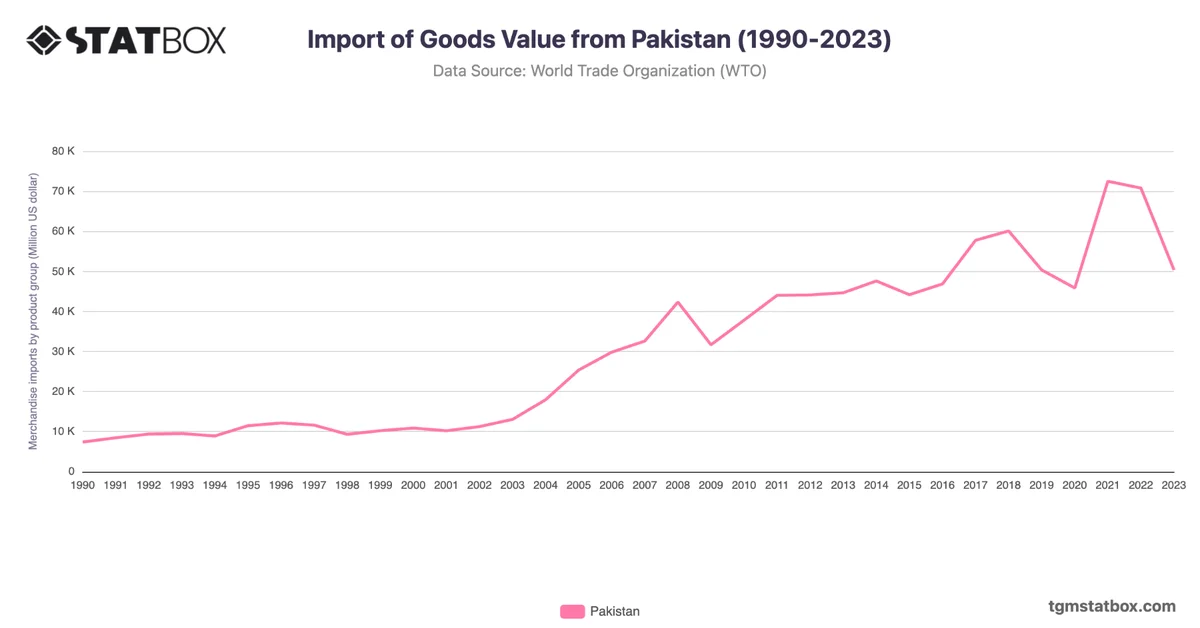
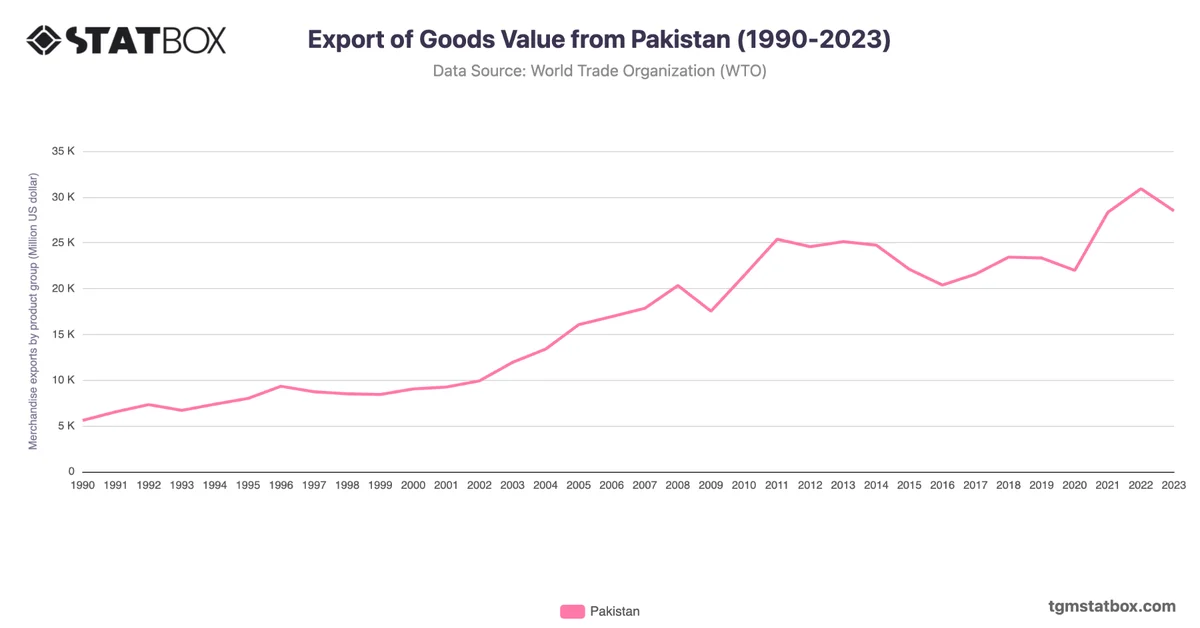
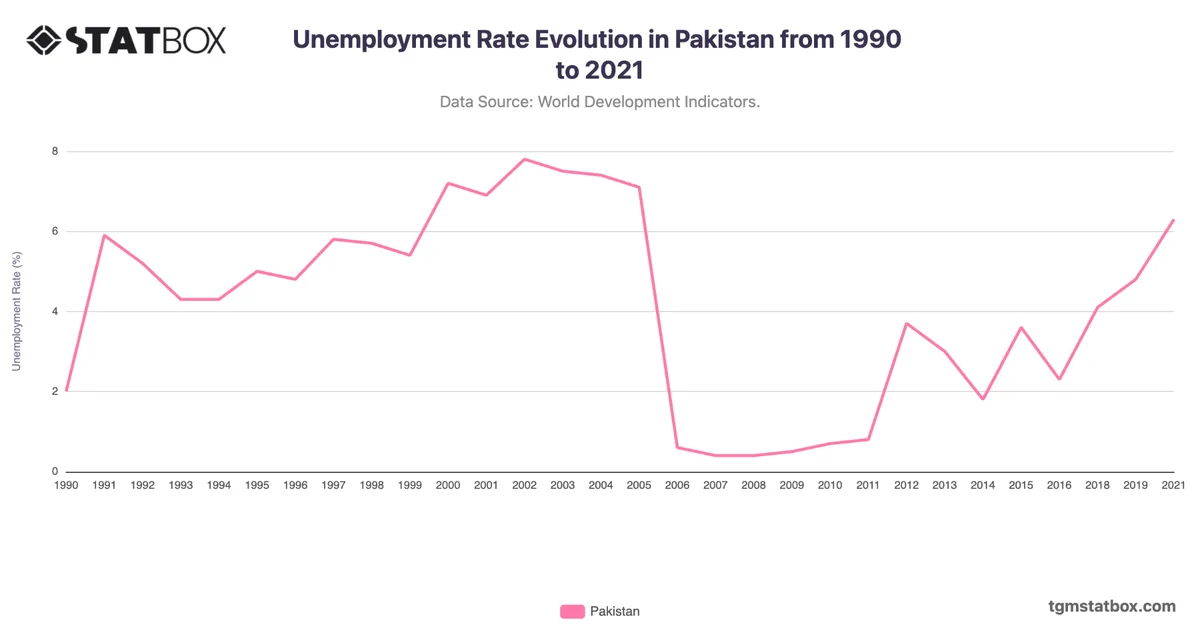
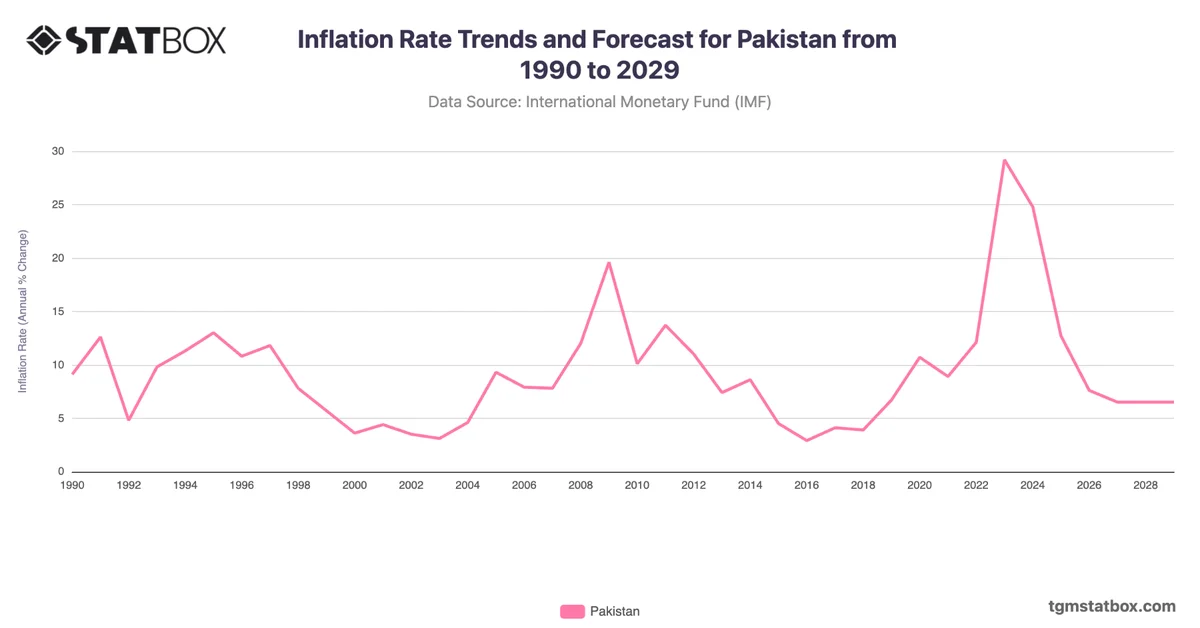
Explore related charts to gain a better understanding of Pakistan’s manufacturing sector share in GDP, Pakistan’s military spending, Pakistan’s annual GDP growth rate.