Peru’s mortality rate saw a consistent decline from 56.8 in 1990 to 11.7 in 2022, reflecting significant strides in public health. By 2000, the rate had decreased to 29.1, driven by initiatives to combat malnutrition, improve water sanitation, and expand maternal care.
The decline continued steadily post-2000, with the rate reaching 15.6 by 2010 and 11.7 by 2022. Peru’s targeted public health programs, particularly in rural areas, and advancements in healthcare infrastructure contributed to this improvement. However, regional disparities in health outcomes remain a concern.
The decline continued steadily post-2000, with the rate reaching 15.6 by 2010 and 11.7 by 2022. Peru’s targeted public health programs, particularly in rural areas, and advancements in healthcare infrastructure contributed to this improvement. However, regional disparities in health outcomes remain a concern.
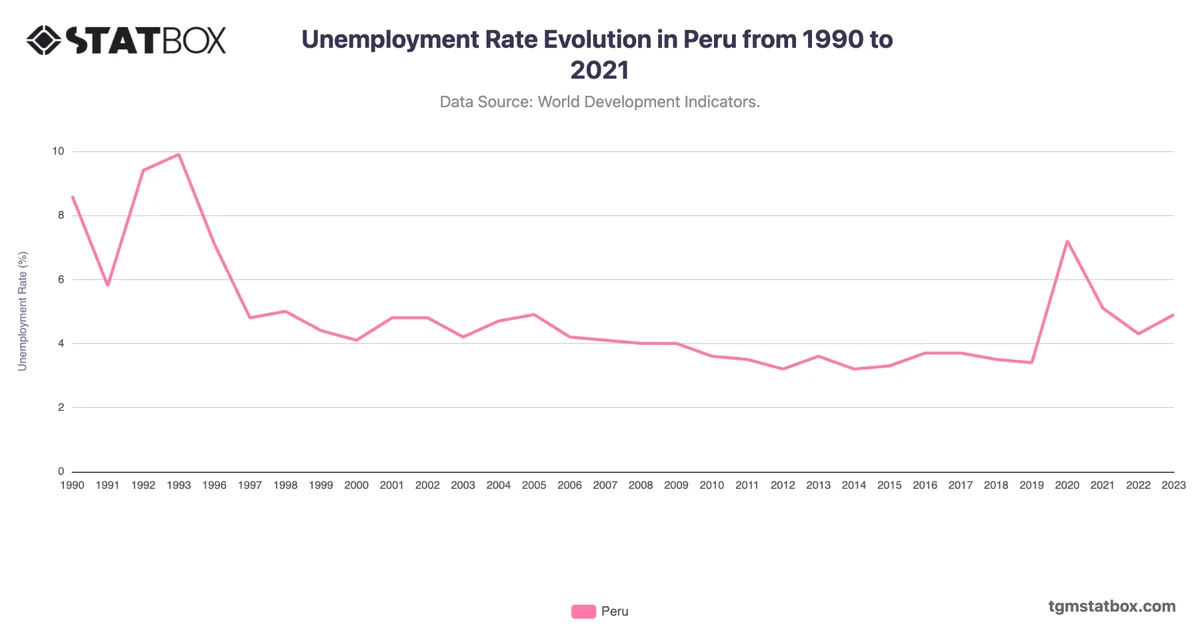
Find out more through related statistics on Peru’s unemployment rate, Fluctuating mortality rate in Peru, Percentage of working-age population in Peru.