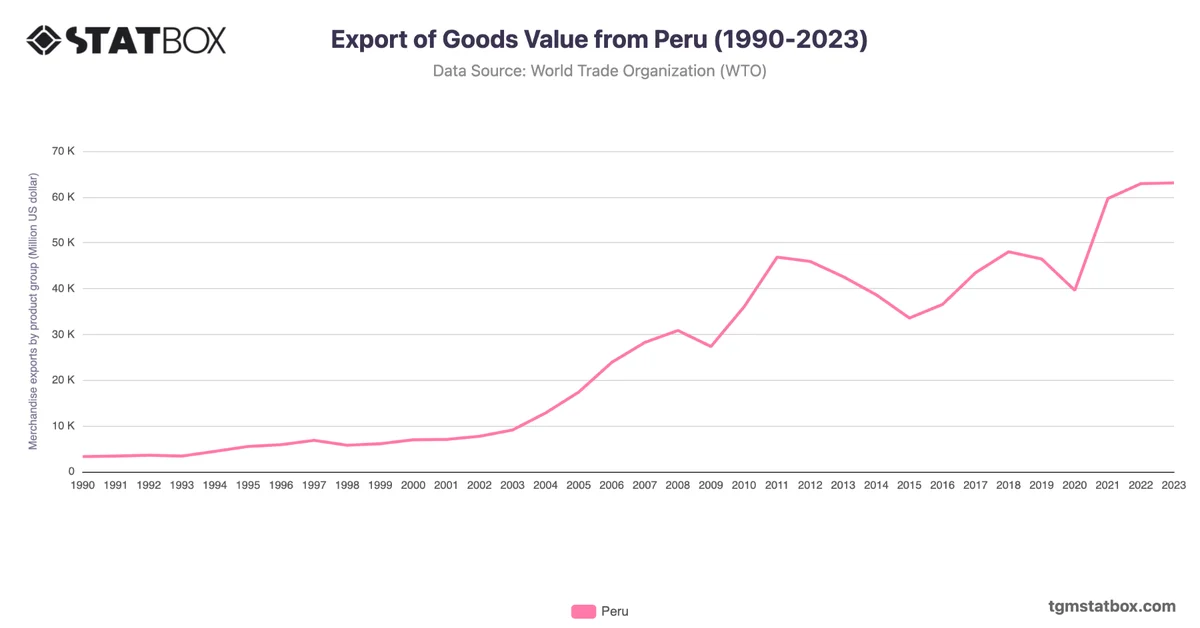
Peru’s import value rose from $2.6B in 1990 to a peak of $60.9B in 2022, reflecting its evolving economy and trade liberalization efforts. A sharp increase between 2004 and 2008, when imports grew from $10.1B to $29.9B, coincided with booming global commodity prices and robust domestic demand.
The global financial crisis caused a dip to $21.8B in 2009, but imports recovered strongly, reaching $50.8B in 2021 due to rising demand for industrial and consumer goods. By 2023, imports stabilized at $52.3B, reflecting steady economic activity amidst global market fluctuations. Peru’s import trends underscore its growing role in regional trade.
The global financial crisis caused a dip to $21.8B in 2009, but imports recovered strongly, reaching $50.8B in 2021 due to rising demand for industrial and consumer goods. By 2023, imports stabilized at $52.3B, reflecting steady economic activity amidst global market fluctuations. Peru’s import trends underscore its growing role in regional trade.
For a deeper dive into the topic, explore Peru’s GDP data, Peru’s annual GDP growth rate, industry’s share in Peru’s GDP.