Chart

Pet Importance Attitudes and Agreement Levels across Asia Pacific 2026

Pet Importance Attitudes and Agreement Levels across Asia Pacific 2026

Share the statistic on social media channels or embed the statistic in your website using "Embed Code", where available.

Share chart

Embed chart
Select Citation

Cite this statistic and select one of the following formats: APA, Chicago, Harvard, MLA & Bluebook


  • APA
  • Chicago
  • Harvard
  • MLA
  • Bluebook
  • IEEE
TGM StatBox. (2026). Pet Importance Attitudes and Agreement Levels across Asia Pacific 2026. TGM StatBox.
Score
  • Strongly agree (Score: 5)
  • Agree (Score: 4)
  • Neither agree nor disagree or Neutral (Score: 3)
  • Disagree (Score: 2)
  • Strongly disagree (Score: 1)
Insights

Key Takeaways

Strength of Pet Attachment Attitudes Across Asia Pacific

The bond between people and their pets carries both personal and social dimensions, influencing household spending priorities, lifestyle decisions, and community norms. Across Asia Pacific, attitudes toward pet ownership sit at the intersection of cultural values and everyday domestic life, making the depth of that attachment a meaningful indicator for consumer-facing industries.

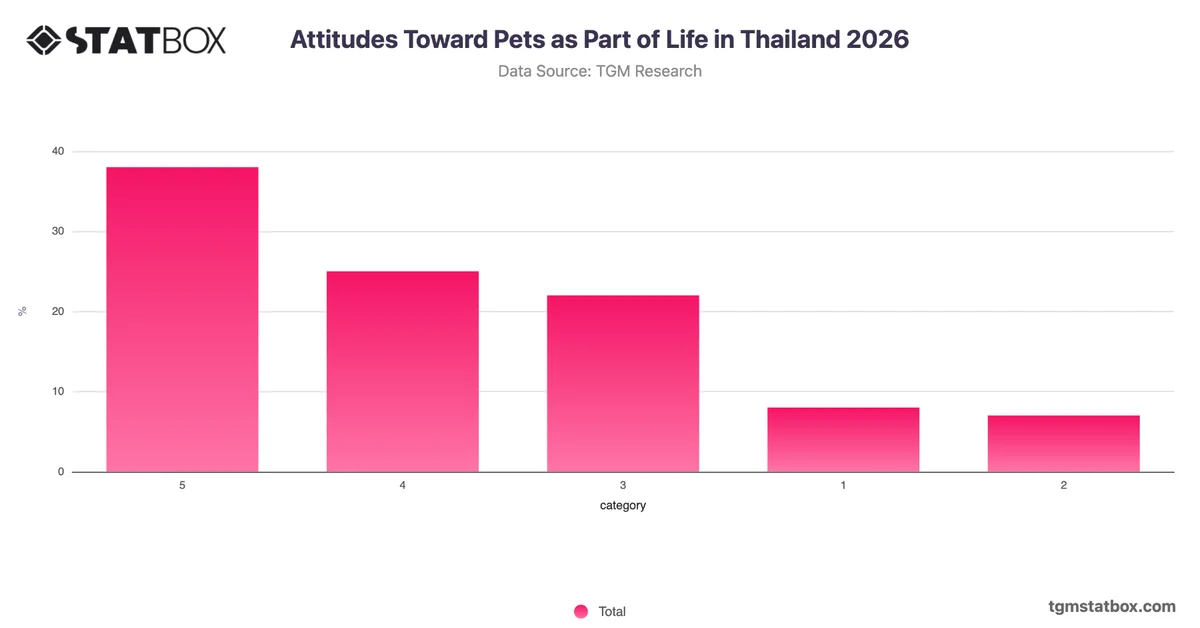
Across Asia Pacific, a majority of respondents lean toward agreement, yet the distribution points to a mismatch between broad acceptance and strong commitment. While 33% express the highest level of agreement and a further 26% sit one step below, a notable 25% occupy the neutral midpoint, indicating that a substantial segment acknowledges pets as important without holding a deeply personal conviction. The combined 17% who lean toward or fully disagree reinforces that this is not a uniformly held sentiment. The concentration of responses across the middle three categories suggests a market where pet relevance is acknowledged broadly but not universally internalised at an emotional level. For organisations targeting pet owners in the region, this pattern indicates value in segmenting communications to distinguish strongly committed pet owners from those with moderate or conditional attachment, rather than treating the audience as a homogeneous group.


AI-powered chart insight: This summary is automatically generated to help you understand the chart at a glance. It is intended as an overview; view the full chart and underlying data for complete context.

Related report

Would You Like to Know More?
Explore Our Pet Care Report

Charts library

Further Recommended Pet Care Statistics

Statbox vector
The briefing
New data, in your inbox

Consumer insights, data stories and product updates as we publish them. No other mail, and one click to leave.

Roughly two emails a month.

Research services
Have a question our newsroom hasn't answered? Ask it directly.

Our team can run the study behind the story — in 60+ countries, on your question, with the data belonging to you.