Pet Ownership Prevalence Across Asia Pacific Consumer Markets
Pet ownership intersects with household decision-making, consumer spending priorities, and lifestyle choices in meaningful ways. Across Asia Pacific, attitudes toward companion animals are shaped by a combination of urban living conditions, cultural norms, and household structures, making ownership rates a relevant indicator of demand patterns within the broader pet care and related consumer goods sectors.
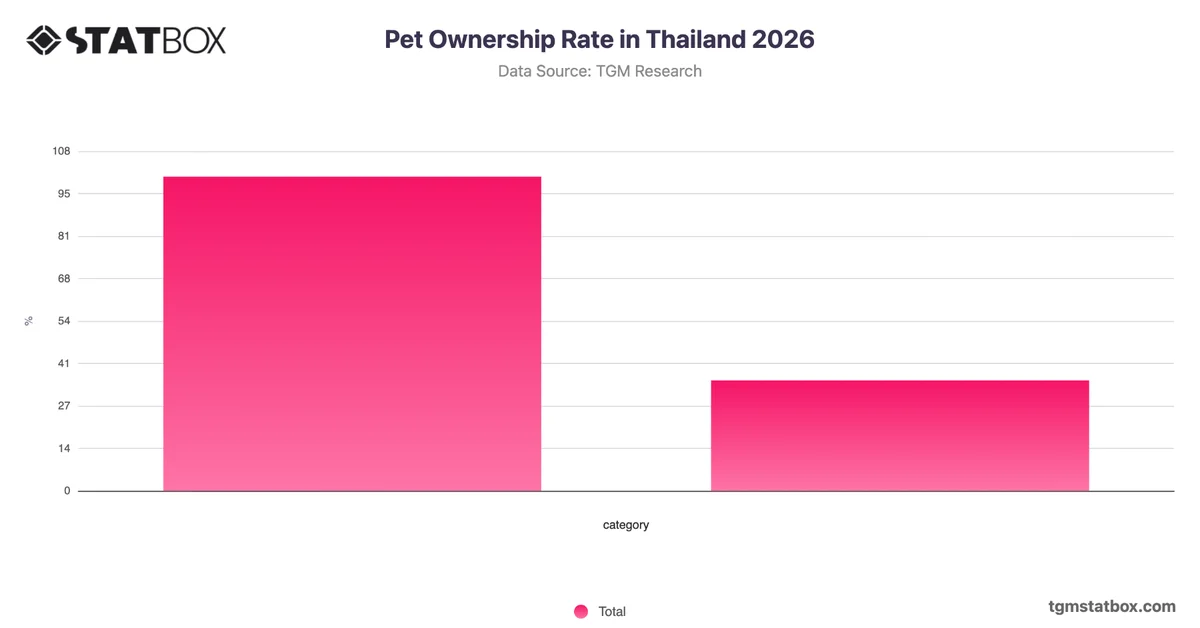
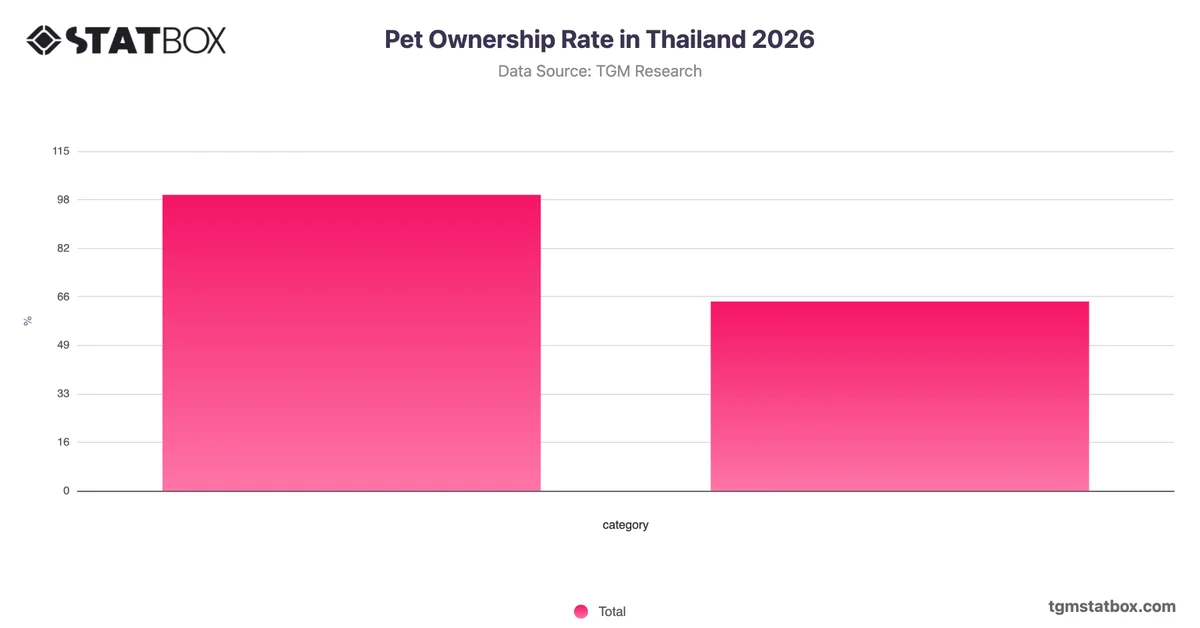
A clear majority of consumers across Asia Pacific currently own at least one pet, with 62% reporting ownership compared to 38% who do not, a gap of 24 percentage points that indicates a market where pet ownership is the more common condition rather than the exception. This distribution suggests that pet-related products and services are addressing a broadly established consumer base rather than a niche audience. The scale of ownership points to a market with considerable depth, where the primary strategic question is less about stimulating initial adoption and more about understanding the variation in ownership types, household compositions, and spending behaviour within that majority. Organisations operating in this space would benefit from segmenting the owner population by pet category and household profile to identify where engagement intensity and commercial potential are most concentrated.