Chart

Lifetime Pet Ownership Rates by Gender across Asia Pacific 2026

Lifetime Pet Ownership Rates by Gender across Asia Pacific 2026

Share the statistic on social media channels or embed the statistic in your website using "Embed Code", where available.

Share chart

Embed chart
Select Citation

Cite this statistic and select one of the following formats: APA, Chicago, Harvard, MLA & Bluebook


  • APA
  • Chicago
  • Harvard
  • MLA
  • Bluebook
  • IEEE
TGM StatBox. (2026). Lifetime Pet Ownership Rates by Gender across Asia Pacific 2026. TGM StatBox.
Insights

Key Takeaways

Gender Symmetry in Pet Ownership Across Asia Pacific

Pet ownership sits at the intersection of lifestyle, household structure, and consumer spending. Across Asia Pacific, attitudes toward keeping animals as companions are shaped by a range of cultural, economic, and domestic factors, making gender a commonly examined variable in understanding how ownership patterns are distributed across the population.

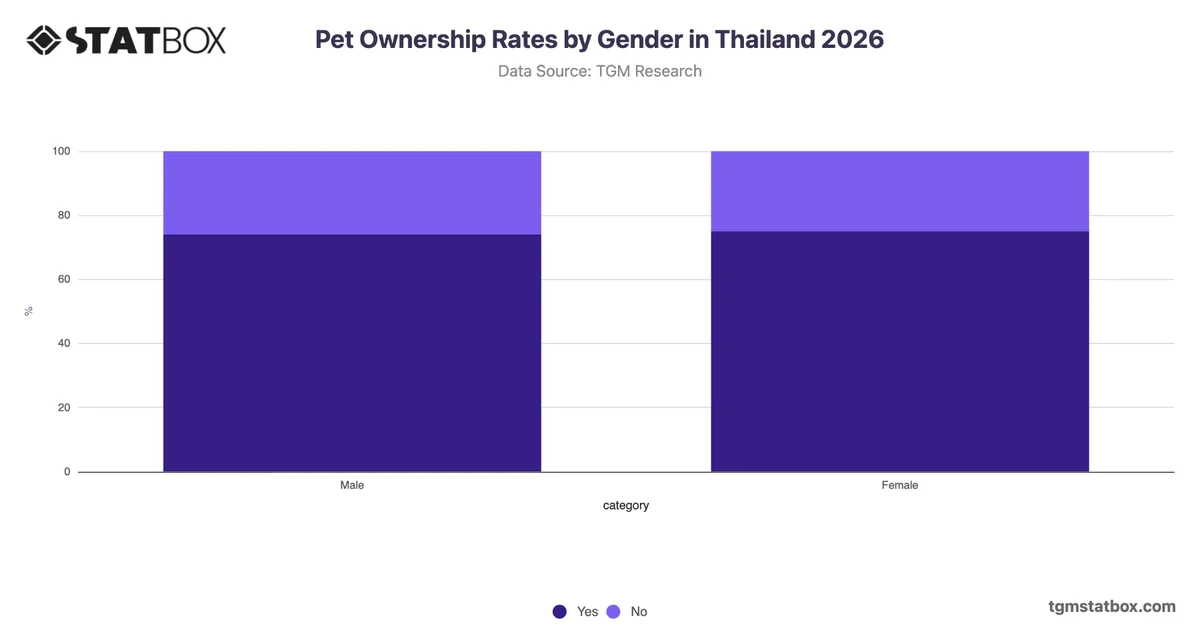
Pet ownership rates across Asia Pacific are notably consistent between male and female respondents, with 53% of males and 55% of females reporting ownership. A two-percentage-point difference is negligible and points to weak gender-based differentiation in this market. Rather than a meaningful demographic gap, the data indicates broadly equivalent ownership behaviour across both groups, suggesting that pet ownership is not a gender-skewed behaviour in this region. For organisations operating in pet-related categories, including food, veterinary services, accessories, and insurance, this pattern suggests that gender segmentation alone is unlikely to be a productive basis for audience targeting or product positioning. Strategies centred on household type, life stage, or geographic market may offer stronger segmentation value than gender-led approaches.


AI-powered chart insight: This summary is automatically generated to help you understand the chart at a glance. It is intended as an overview; view the full chart and underlying data for complete context.

Related report

Would You Like to Know More?
Explore Our Pet Care Report

Charts library

Further Recommended Pet Care Statistics

Statbox vector
The briefing
New data, in your inbox

Consumer insights, data stories and product updates as we publish them. No other mail, and one click to leave.

Roughly two emails a month.

Research services
Have a question our newsroom hasn't answered? Ask it directly.

Our team can run the study behind the story — in 60+ countries, on your question, with the data belonging to you.