Pet Ownership Prevalence Among Chinese Adults
Pet ownership occupies a distinct position in consumer culture, influencing household spending patterns, lifestyle choices, and product category demand. In China, the relationship between adults and companion animals intersects with urbanisation, changing household structures, and attitudes toward companionship and wellbeing. Understanding the baseline prevalence of pet ownership among the adult population provides a foundation for assessing market composition and consumer segmentation across relevant product and service categories.
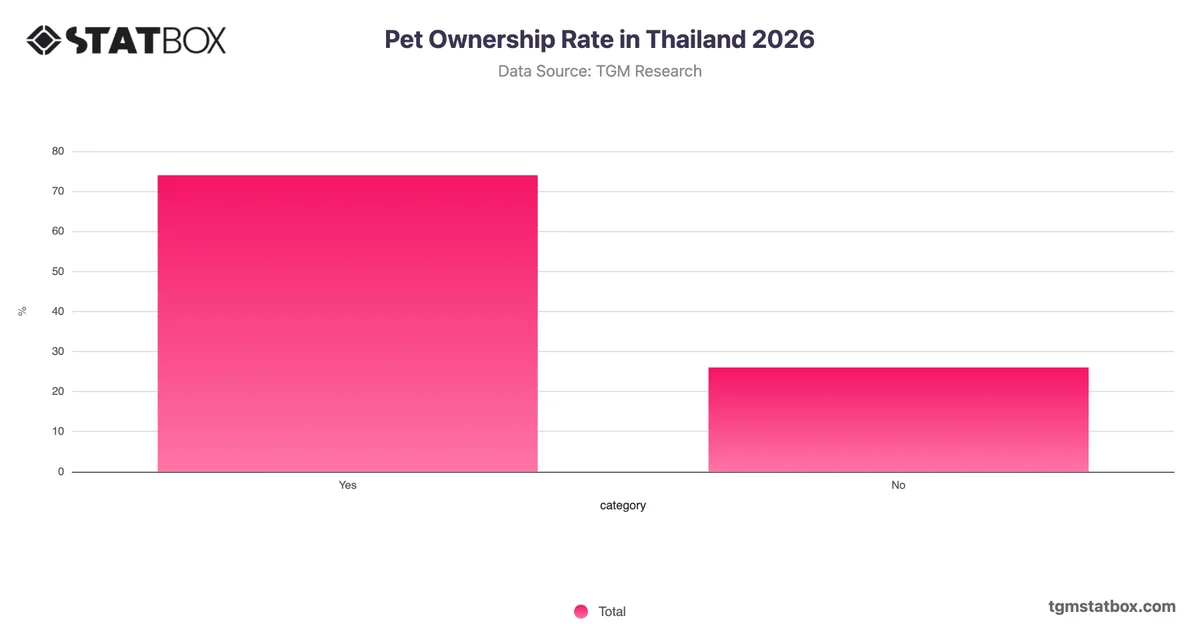
A modest but meaningful majority of Chinese adults report having owned a pet at some point, with 56% answering affirmatively compared to 44% who have not. The 12-percentage-point gap indicates a population that is broadly divided rather than uniformly aligned, suggesting that pet ownership has achieved majority reach without approaching near-universal adoption. This pattern points to a market where a substantial non-owner segment remains present and cannot be treated as a marginal audience. The distinction between ever-ownership and current ownership is also commercially relevant; past owners who no longer keep pets may represent a segment with latent familiarity and lower barriers to re-engagement. Organisations operating in pet-related categories should investigate whether lapsed ownership or non-ownership stems from practical constraints, attitudinal factors, or life-stage considerations, as this distinction would meaningfully inform acquisition and re-engagement strategies.