Share the statistic on social media channels or embed the statistic in your website using "Embed Code", where available.
Share chart
Embed chart Embed copied!Cite this statistic and select one of the following formats: APA, Chicago, Harvard, MLA & Bluebook
"Which of the following statements about paying for things are true for you?"
Key Takeaways
In Brazil, paying with cash is still pretty common, with about a third of people using it as much as possible. At the same time, digital payment methods are growing fast, around 36% have their credit card info saved on their phones, and about 24% use payment apps to send money to friends. Some also keep their card info on their computers, and a smaller group has tried using crypto for purchases. Interestingly, a fair number have set up mobile wallets but don’t actually use them, showing there’s interest but maybe some hesitation.
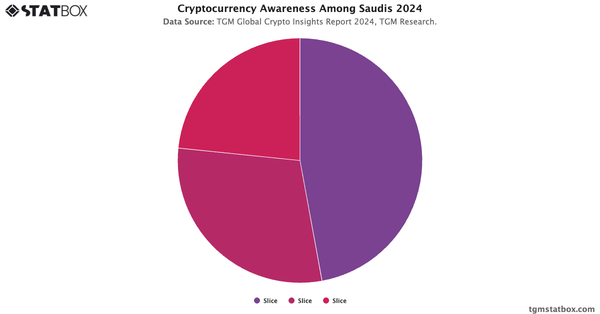
For further insights, explore Brazilians’ cryptocurrency interest, Brazil’s cryptocurrency awareness, most popular crypto exchanges in Brazil.

Cryptocurrency Insights Report in Brazil
Learn more about Cryptocurrency users in Brazil with TGM StatBox. Explore in-depth insight report, featuring user behavior, trends, and preferences.
Go to report


Connect with our expert team for immediate assistance or comprehensive market analysis. We are always ready to support your business needs.