Topic
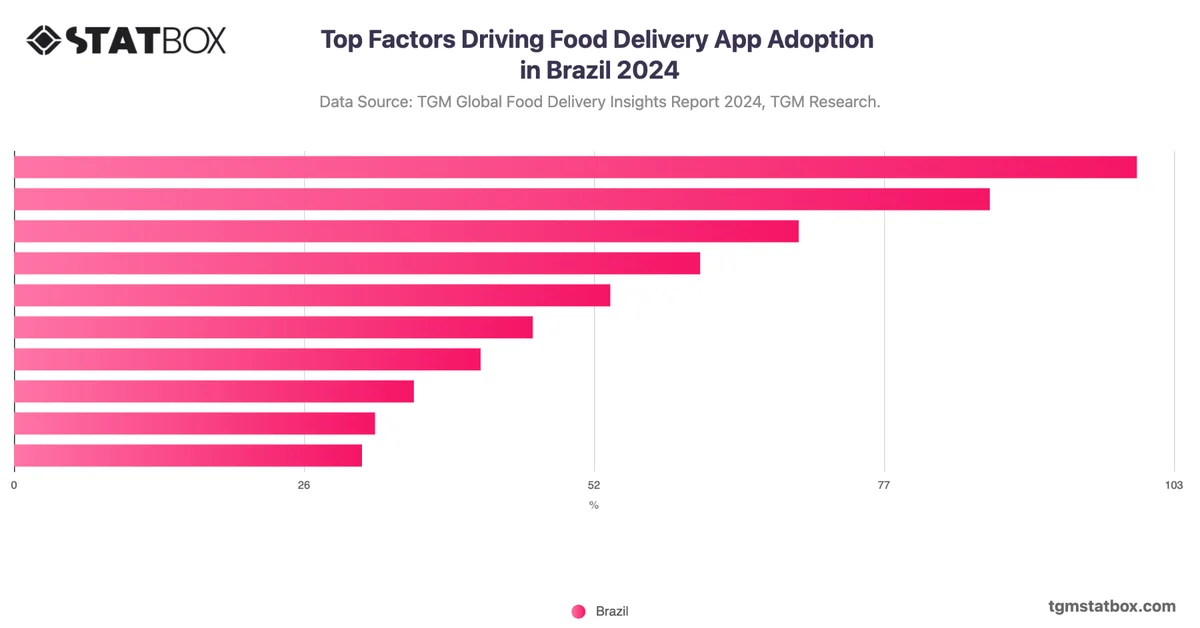
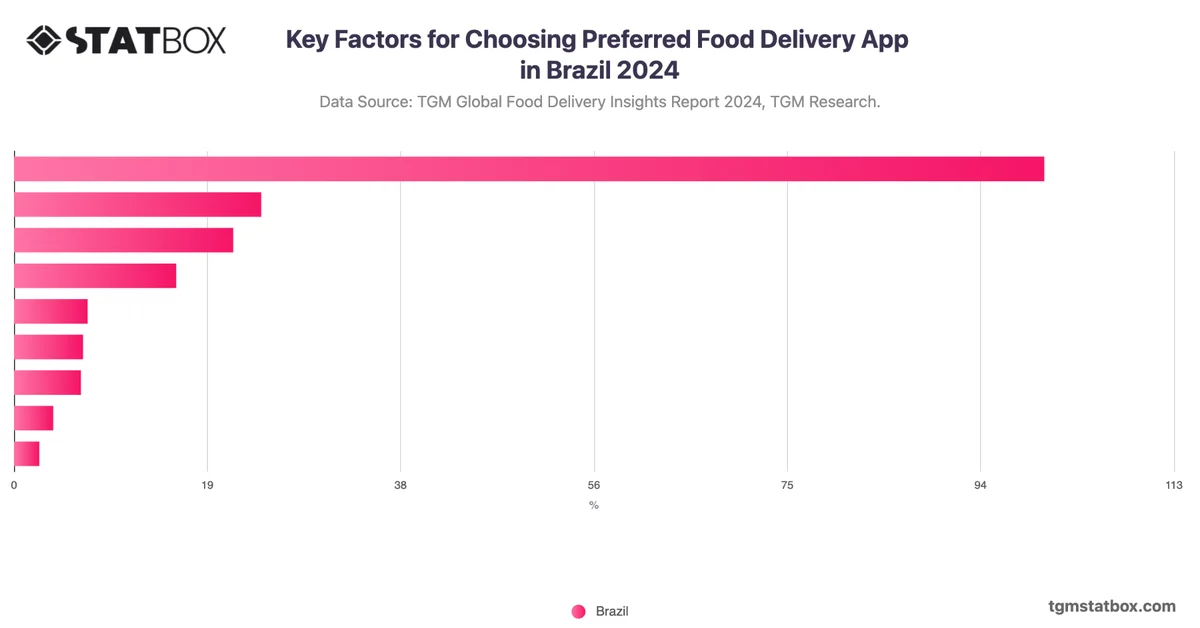
Brazilians use food delivery apps mainly to avoid cooking.
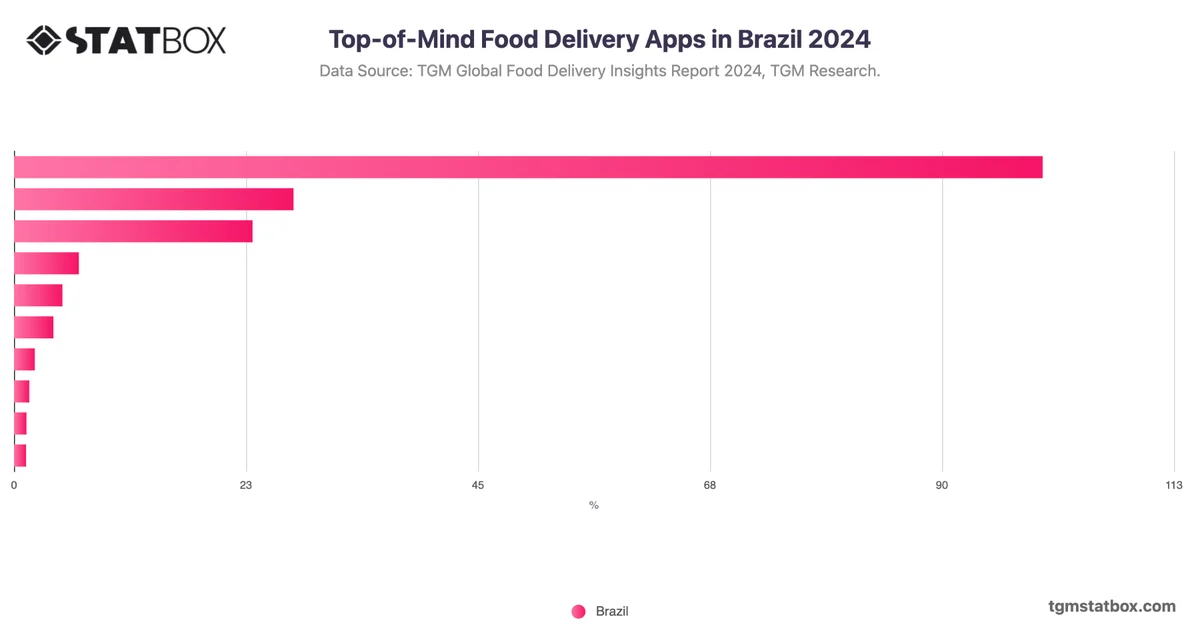
iFood dominates the Brazilian market.
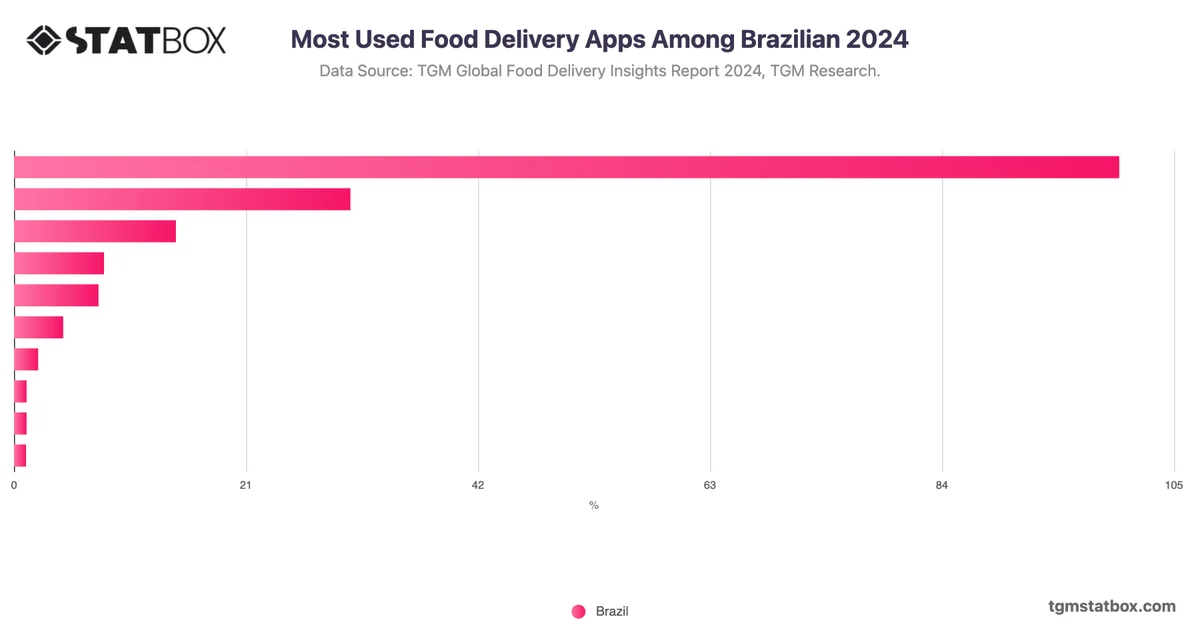
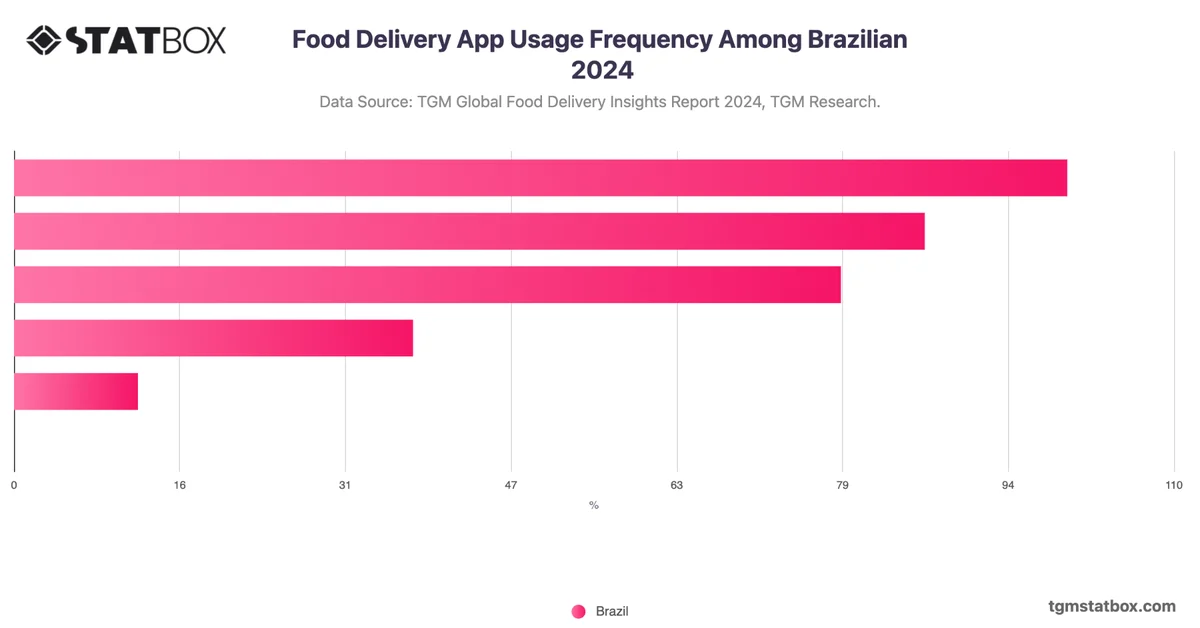
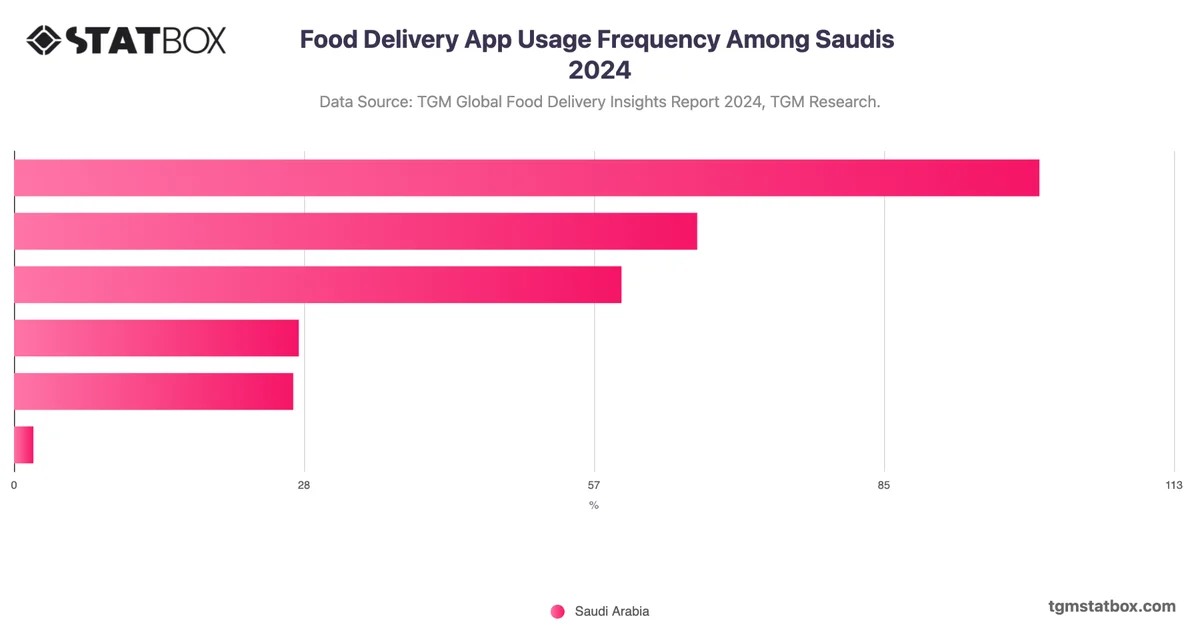
71.3% of users use food delivery apps at least once a week.
About this topic

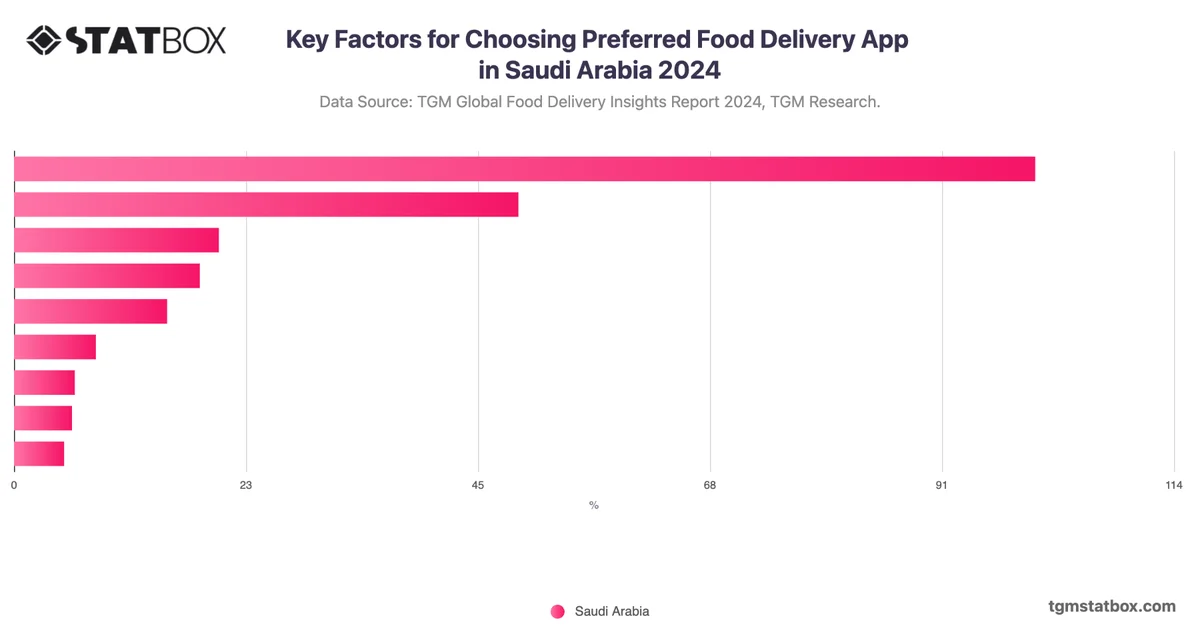
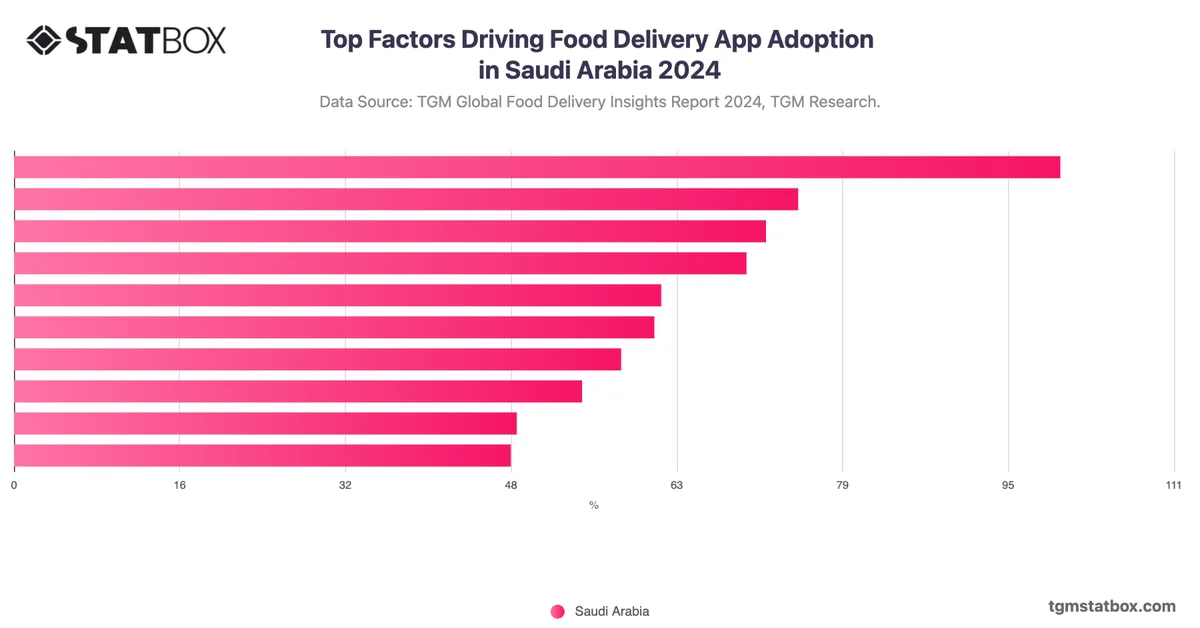
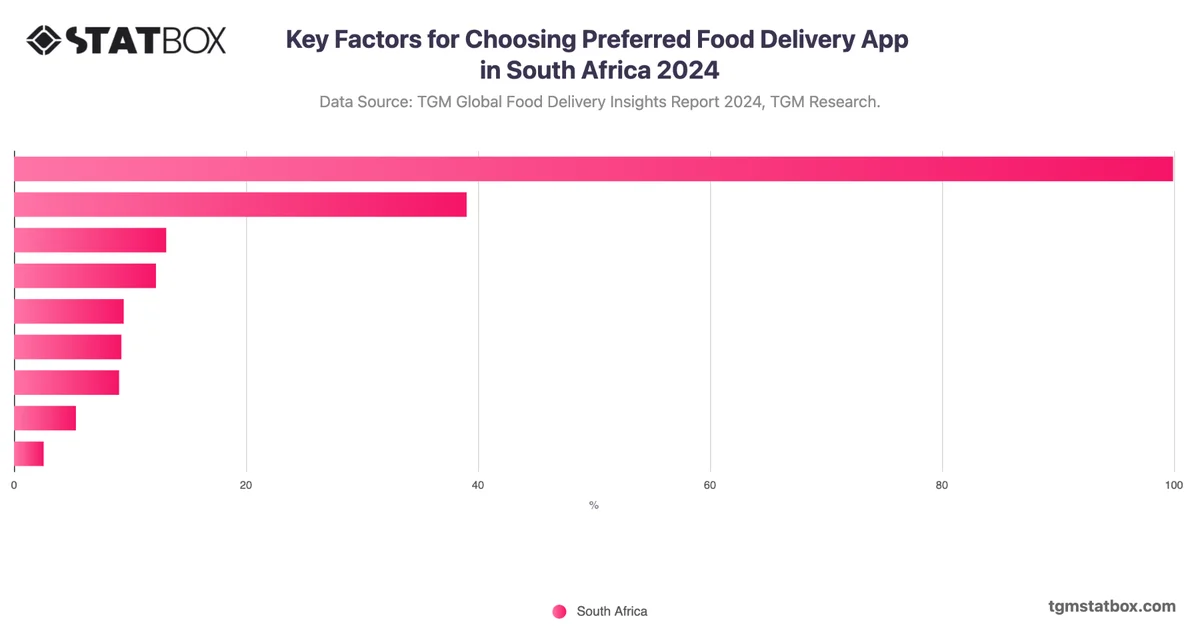
A large portion of Brazilians, around 71.3%, use food delivery apps at least once a week, illustrating just how embedded these platforms have become in daily life. This frequency of use highlights a shift in lifestyle, where convenience and ease have overtaken traditional dining habits. For many, the appeal lies in the ability to avoid cooking altogether—one of the primary reasons people turn to food delivery services. Beyond the convenience, food delivery apps also cater to specific cravings. 33.7% of users chooses to order food simply to satisfy a longing for particular dishes, something that the flexibility of delivery platforms easily accommodates. Furthermore, promotions and discounts are a strong driving force in this growing trend. A significant portion of consumers is drawn to food delivery apps by the cost-saving opportunities they provide.
iFood leads Brazil's food delivery market with nearly 90% of users associating the brand with food delivery services. This dominance is due to its early market entry, aggressive marketing, and a strong relationship with restaurant partners. While competitors like Uber Eats and Rappi are present in the market, they lag behind in brand recall and market share. For competitors, replicating iFood’s success would require not just operational efficiency but a significant shift in both market strategy and brand positioning to capture the hard-to-achieve trust and recognition from consumers.
*Disclaimer: The information provided by TGM StatBox is intended for general informational purposes only. TGM StatBox does not assume liability for the completeness or accuracy of the information provided. Due to frequent updates, statistics may be more current than mentioned in the text. Please independently verify the information and consult experts as needed.
Reports hub

Charts library

Topics library

Consumer insights, data stories and product updates as we publish them. No other mail, and one click to leave.
Roughly two emails a month.
Our team can run the study behind the story — in 60+ countries, on your question, with the data belonging to you.
Type at least two characters to search.