Share the statistic on social media channels or embed the statistic in your website using "Embed Code", where available.
Share chart
Embed chart Embed copied!Cite this statistic and select one of the following formats: APA, Chicago, Harvard, MLA & Bluebook
"Which of the following statements about paying for things are true for you?"
Key Takeaways
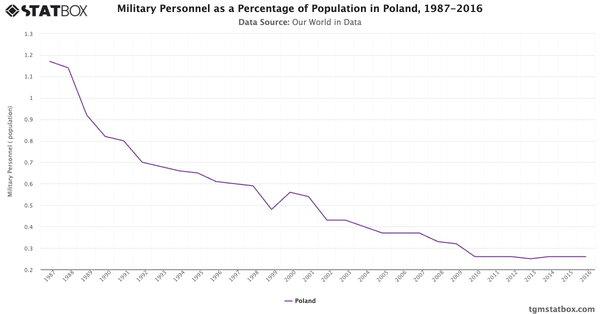
In Poland, cash is still a popular choice, with about 41% of people paying with cash whenever they can. Storing credit card info on phones or computers is less common, around 16% and 11% respectively. Sending money through social media or payment apps is used by a smaller group. Interestingly, only about 6% have used cryptocurrency for purchases.
Find out more through related statistics on Poles’ cryptocurrency engagement levels, Poland’s cryptocurrency adoption rate, Poland’s cryptocurrency awareness.

Cryptocurrency Insights Report in Poland
Find out about Cryptocurrency users in Poland with TGM StatBox. Access our detailed report, including graphs and tables, to uncover the market's trends.
Go to report


Connect with our expert team for immediate assistance or comprehensive market analysis. We are always ready to support your business needs.