Preferred Types of Trips Among American Travelers 2025

Preferred Types of Trips Among American Travelers 2025

Share the statistic on social media channels or embed the statistic in your website using "Embed Code", where available.

Share chart

Embed chart
Select Citation

Cite this statistic and select one of the following formats: APA, Chicago, Harvard, MLA & Bluebook
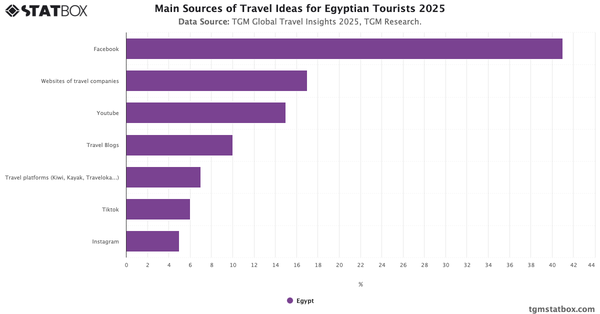

  • APA
  • Chicago
  • Harvard
  • MLA
  • Bluebook
  • IEEE
TGM StatBox. (2025). Preferred Types of Trips Among American Travelers 2025. TGM StatBox.
Chart Details
Country: USA
Type of survey: CAWI
Number of respondents: 1000
Age group: 18-55+
Published date: 2025
Survey Question: 
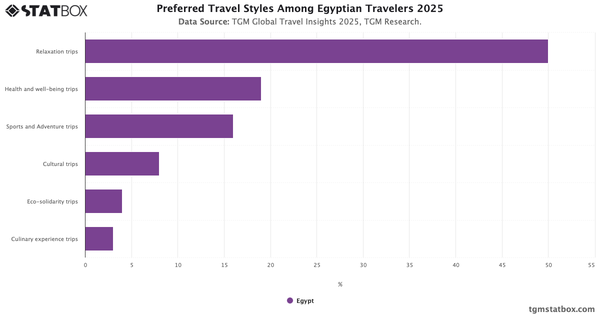
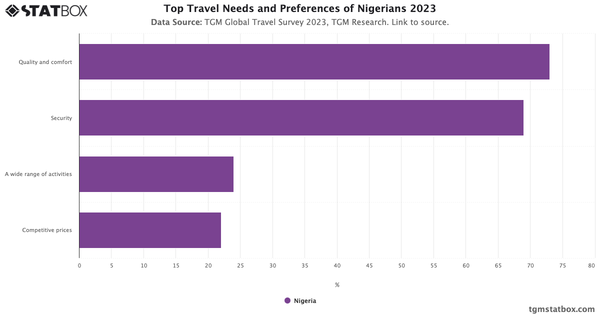
"Which types of trips \ travel styles are most suitable for you?"
Key Takeaways
In 2025, 63% of American travelers favor relaxation trips. This overwhelming preference far outpaces niche segments such as health and wellness, adventure, and cultural exploration, reflecting a national trend toward mental recovery and work-life balance. The rising popularity of remote work and digital burnout may be fueling this shift, as consumers increasingly seek travel as a form of emotional reset. Meanwhile, interest in eco-solidarity and culinary experiences remains modest at 5% each, highlighting opportunities for growth among more purposeful or immersive travel categories.

Would you like to know more?
Check our report on this topic

American Traveler Insights Report

The United States Travel Report 2025

American Traveler Insights Report

Discover all you need to know about Travelers in USA with TGM StatBox. Get the comprehensive Travel report, featuring graphs and tables for insights.

Go to report

Further Recommended Statistics

Statbox vector
Statbox |form contact icon

Have Other Queries?

Statbox vector

Connect with our expert team for immediate assistance or comprehensive market analysis. We are always ready to support your business needs.