Share the statistic on social media channels or embed the statistic in your website using "Embed Code", where available.
Share chart
Embed chart Embed copied!Cite this statistic and select one of the following formats: APA, Chicago, Harvard, MLA & Bluebook
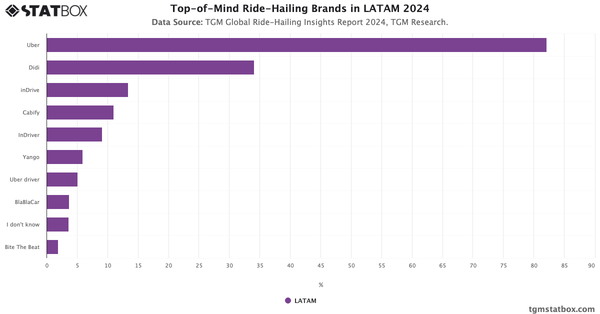
"How often do you use ridesharing apps?"
Key Takeaways
Ride-hailing apps have become a regular part of many people’s routines. About 52.4% of global respondents use these services at least once a week. For some, they rely on the convenience and flexibility that ride-hailing offers, whether it’s for commuting, running errands, or avoiding parking hassles. A sizable group also uses ride-hailing apps a few times a month, treating them more as a backup option for specific needs rather than a daily habit—for example, on days when they’re feeling sick or have a late-night event where safety and convenience matter more.

Global Ride-Hailing Insights Report
Learn more about global ride-hailing consumers with TGM Ride-Hailing Insights Reports. Explore in-depth insight report, featuring user behavior, trends, and preferences.
Go to report


Connect with our expert team for immediate assistance or comprehensive market analysis. We are always ready to support your business needs.