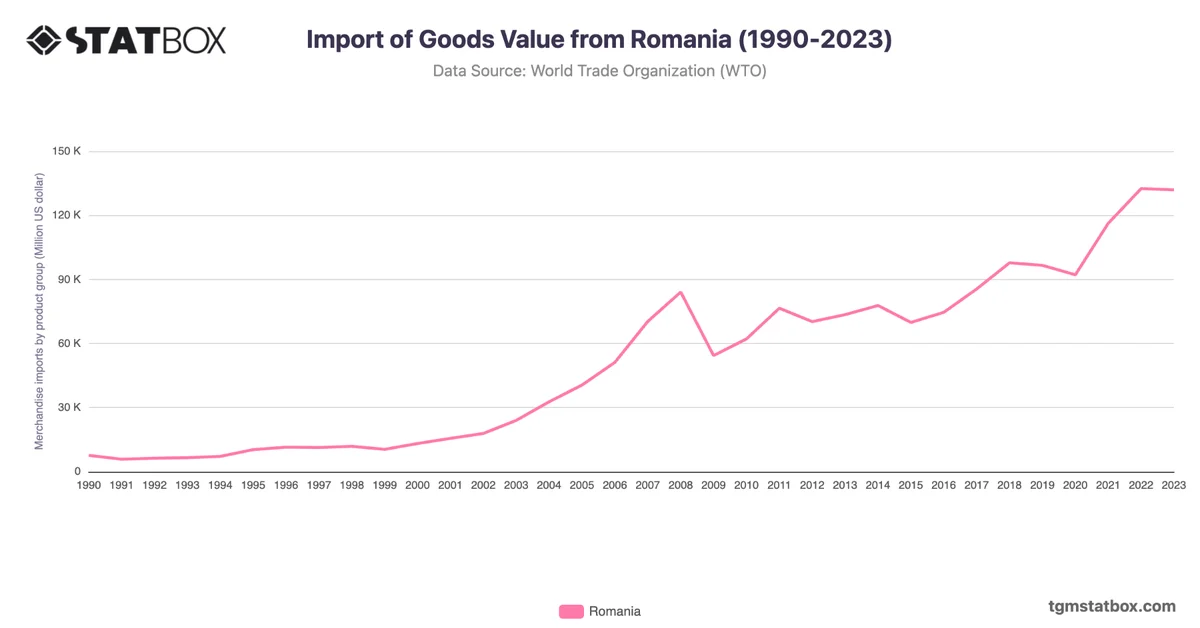
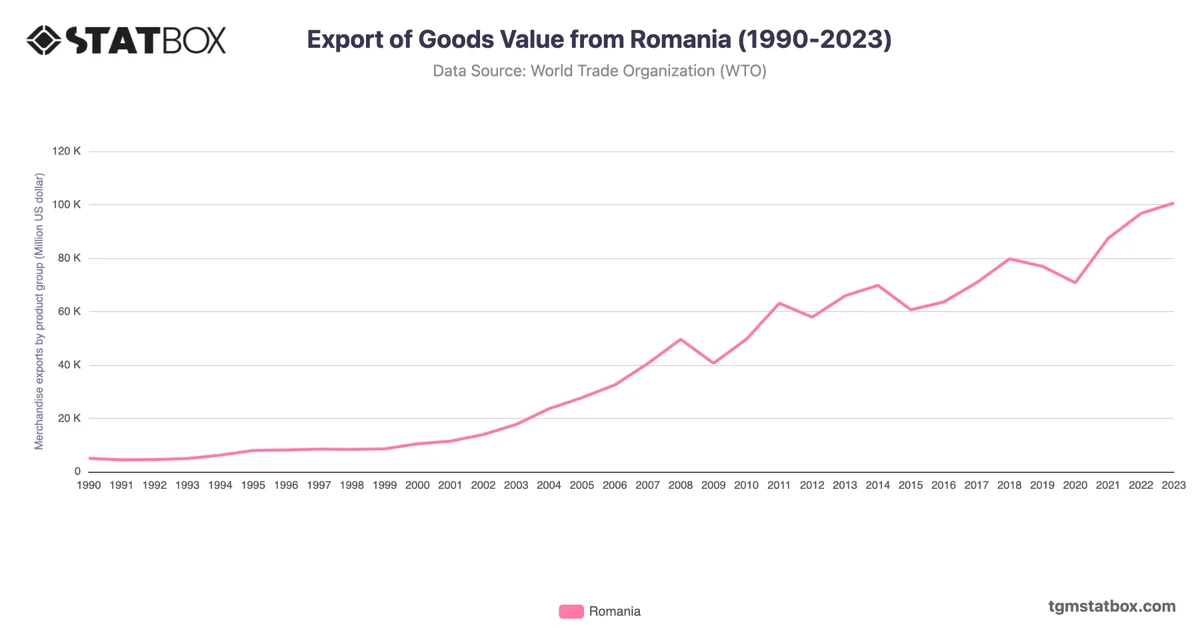
Romania experienced a widening trade deficit over the 2017–2023 period, with the gap increasing from -14,724.5 million USD in 2017 to a peak of -35,769.5 million USD in 2022. This trend reflects rising imports of machinery, electronics, and consumer goods, fueled by robust domestic demand and economic growth.
In 2023, the deficit narrowed to -31,300.4 million USD, as export growth in sectors such as automotive and agriculture helped mitigate import pressures. Romania’s trade performance highlights the challenges of maintaining export competitiveness while managing a growing reliance on imported goods to support industrial and consumer markets.
In 2023, the deficit narrowed to -31,300.4 million USD, as export growth in sectors such as automotive and agriculture helped mitigate import pressures. Romania’s trade performance highlights the challenges of maintaining export competitiveness while managing a growing reliance on imported goods to support industrial and consumer markets.
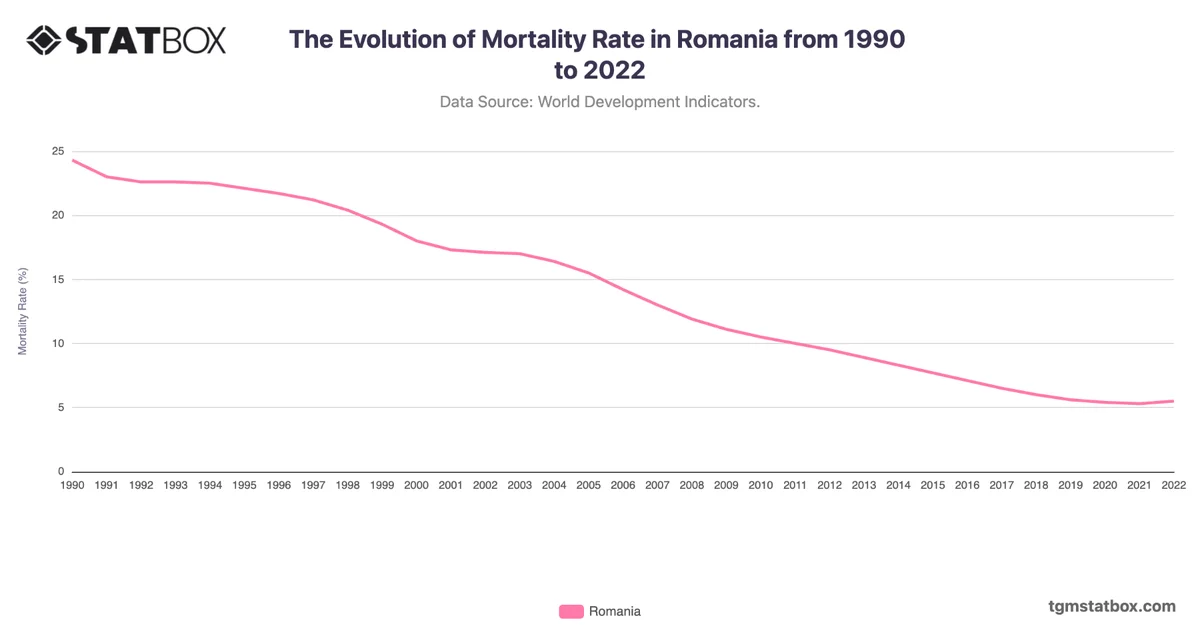
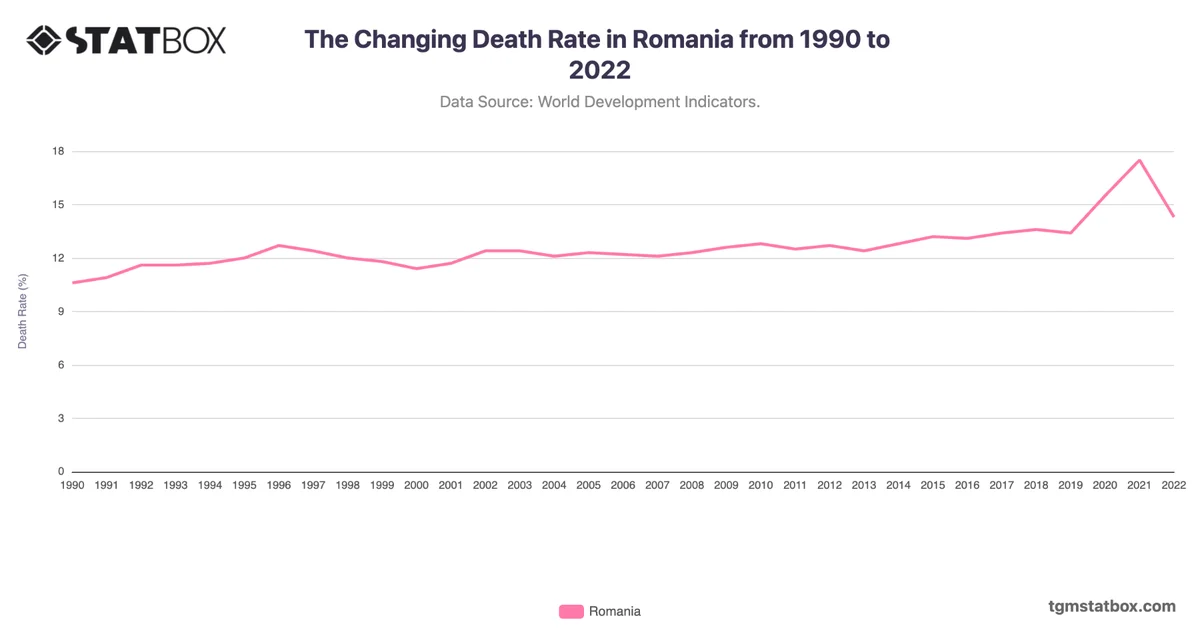
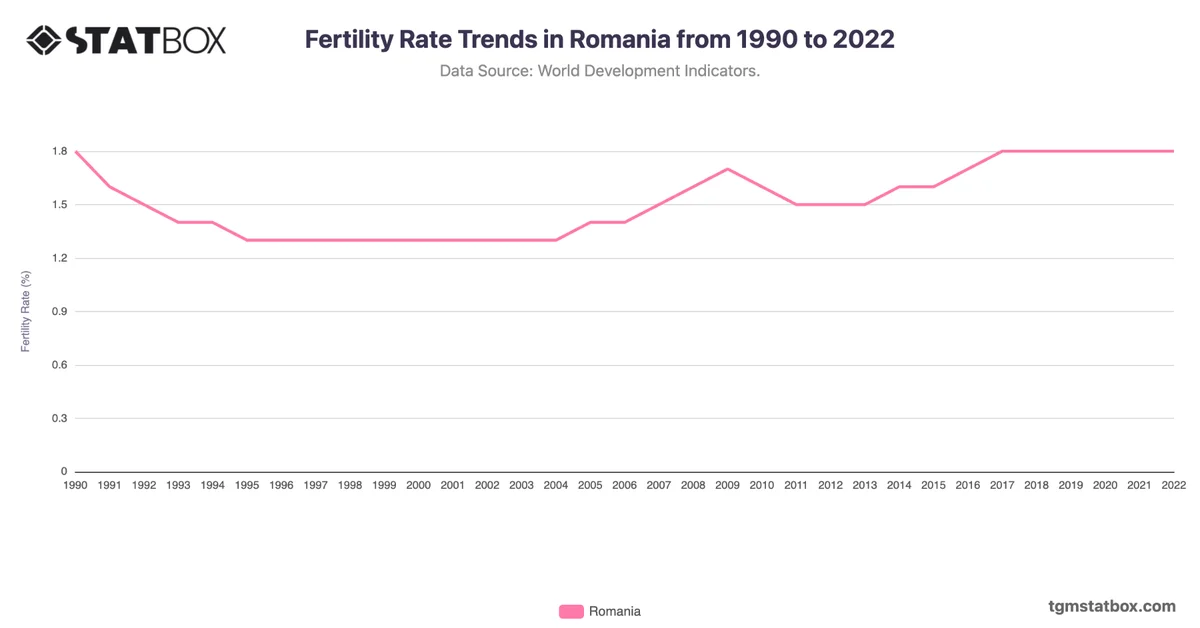
Find out more through related statistics on Romania’s working age population percentage, Romania’s mortality trend, Romania’s population statistics.