Romania's unemployment rate has shown notable fluctuations from the early 1990s, starting with an increase to 8.3% in 1992, reflecting the economic challenges following the fall of communism. Throughout the mid-90s, unemployment decreased slightly, reaching 5.5% in 1997 as market reforms began stabilizing the economy. However, the early 2000s saw periodic increases, with unemployment peaking at 8.1% in 2002, largely due to the economic restructuring that led to temporary job losses.
The unemployment rate then gradually declined, reaching 5.8% in 2008 before the global financial crisis caused a rebound to 7% in 2010. Post-crisis, Romania saw a steady decline in unemployment, reaching a record low of 3.9% in 2019, driven by economic growth and a shift toward higher employment in urban areas. However, the COVID-19 pandemic led to a rise in unemployment to 5.6% by 2021, as industries faced lockdowns and disruptions, with recovery stabilizing only in subsequent years.
The unemployment rate then gradually declined, reaching 5.8% in 2008 before the global financial crisis caused a rebound to 7% in 2010. Post-crisis, Romania saw a steady decline in unemployment, reaching a record low of 3.9% in 2019, driven by economic growth and a shift toward higher employment in urban areas. However, the COVID-19 pandemic led to a rise in unemployment to 5.6% by 2021, as industries faced lockdowns and disruptions, with recovery stabilizing only in subsequent years.
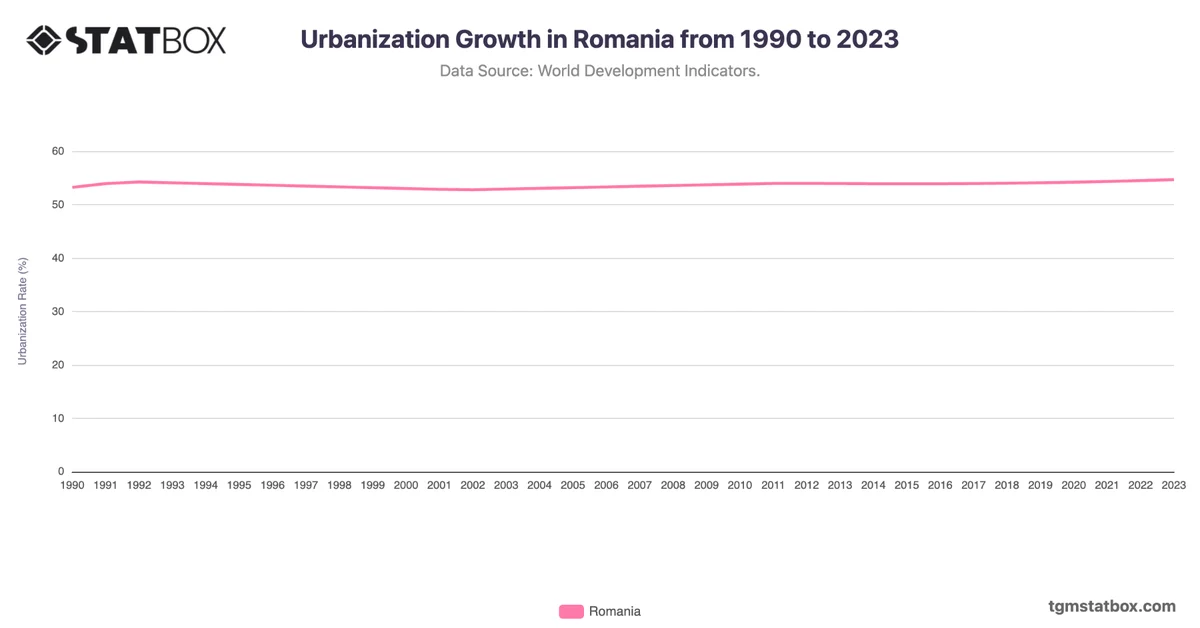
For additional information, visit statistics on Romania’s working age population percentage, Romania’s urbanization rate, yearly GDP growth rate for Romania.