Romania's exports have grown substantially since 1990, starting at $4.96 billion and reflecting a transition from a centralized economy to market-driven dynamics. The early 2000s marked a pivotal era, with exports rising from $10.41 billion in 2000 to $40.49 billion by 2007, fueled by EU accession in 2007 and foreign investment in manufacturing and technology sectors.
The global financial crisis in 2009 caused a temporary drop to $40.57 billion. However, by 2023, exports climbed to $100.61 billion, aided by robust automotive and electronics sectors. Trade diversification and Romania’s integration into global supply chains played a crucial role in this upward trend.
The global financial crisis in 2009 caused a temporary drop to $40.57 billion. However, by 2023, exports climbed to $100.61 billion, aided by robust automotive and electronics sectors. Trade diversification and Romania’s integration into global supply chains played a crucial role in this upward trend.
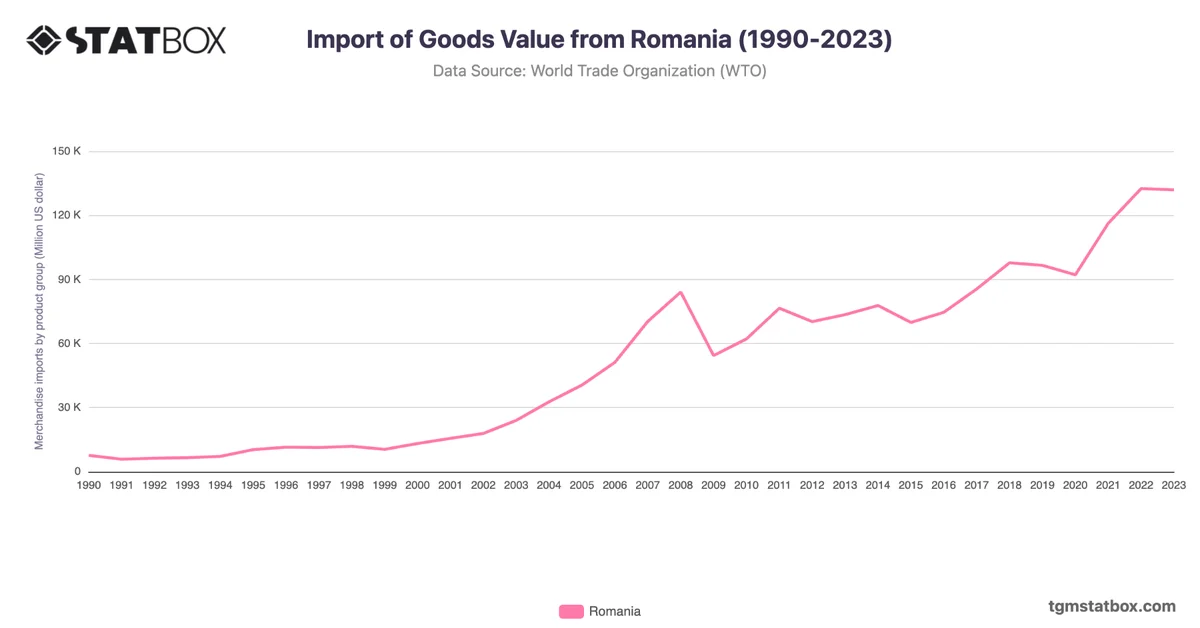
Explore related charts to gain a better understanding of Romania’s import value, Romania’s GDP share from services, Romania’s population statistics.