Romania's central government debt displayed a fluctuating trajectory from 1995 to 2022, reflecting varying economic challenges and policy adjustments. Between 1995 and 2008, the debt-to-GDP ratio remained relatively low, declining from 18.82% in 1995 to a low of 12.49% in 2008. This period of reduction was driven by strong economic growth and fiscal consolidation efforts, aligning with Romania's aspirations to join the European Union in 2007.
The 2009 global financial crisis marked a turning point, pushing the debt to 21.19% as Romania implemented fiscal stimulus measures to mitigate the recession's impact. By 2014, the ratio rose to 38.33%, reflecting the cumulative effects of increased borrowing during the crisis and slow recovery. Post-2015, debt hovered around 35%-38%, with minor fluctuations. However, the COVID-19 pandemic caused a sharp surge, with the debt ratio peaking at 49.09% in 2021 due to fiscal support measures and declining GDP. Despite a partial recovery in 2022, debt remained elevated at 47.63%.
The 2009 global financial crisis marked a turning point, pushing the debt to 21.19% as Romania implemented fiscal stimulus measures to mitigate the recession's impact. By 2014, the ratio rose to 38.33%, reflecting the cumulative effects of increased borrowing during the crisis and slow recovery. Post-2015, debt hovered around 35%-38%, with minor fluctuations. However, the COVID-19 pandemic caused a sharp surge, with the debt ratio peaking at 49.09% in 2021 due to fiscal support measures and declining GDP. Despite a partial recovery in 2022, debt remained elevated at 47.63%.
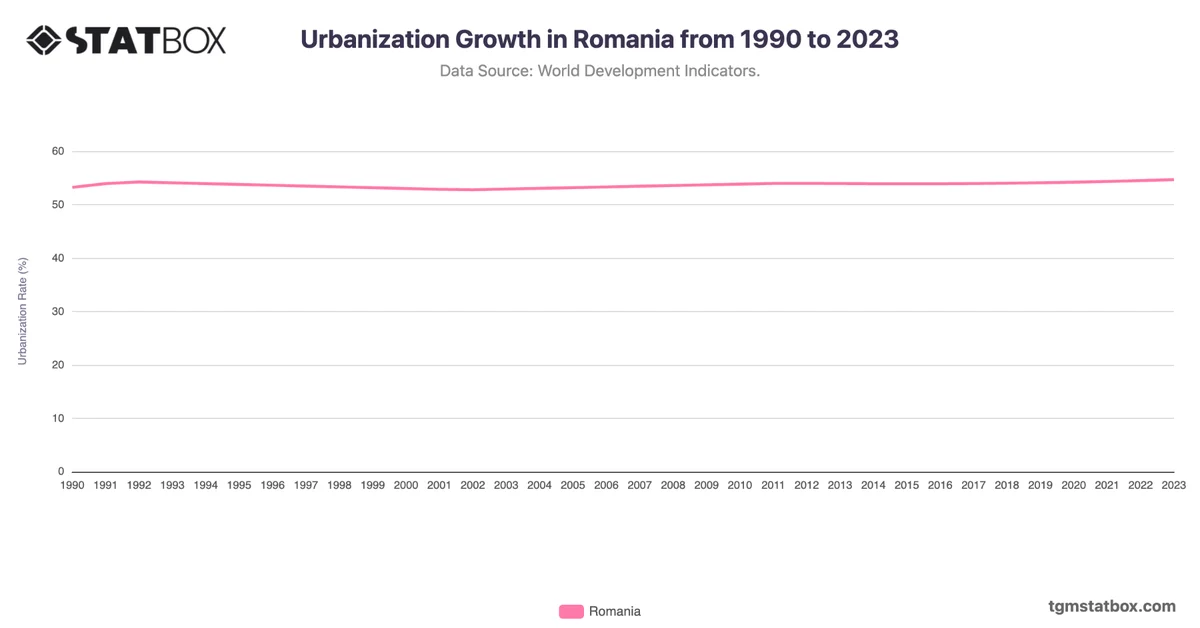
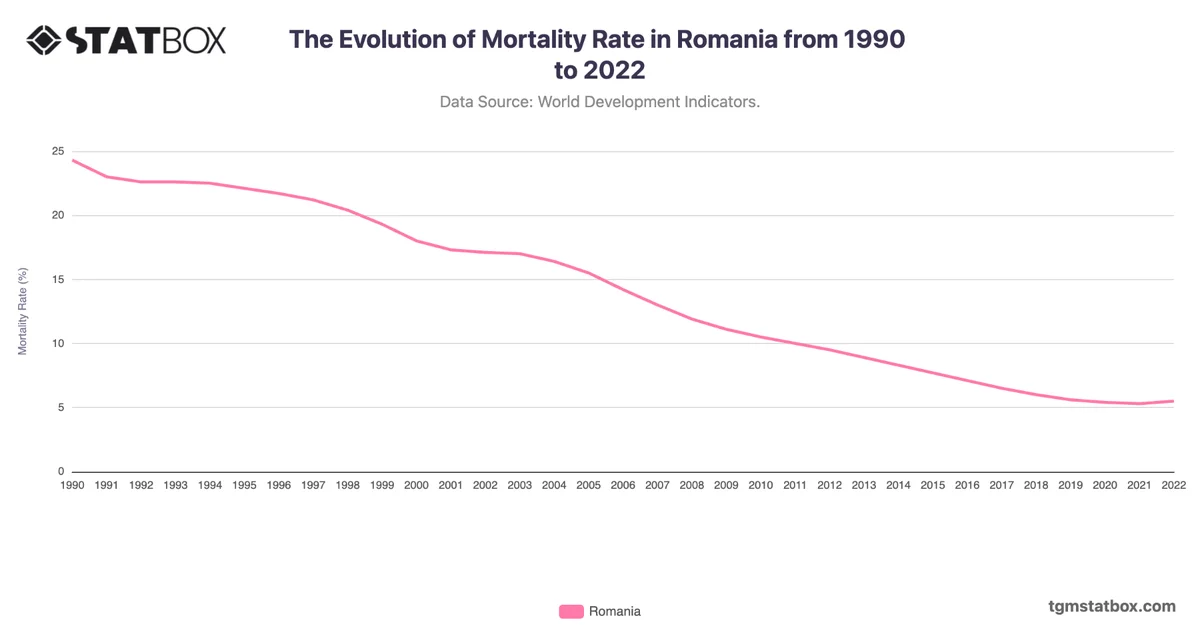
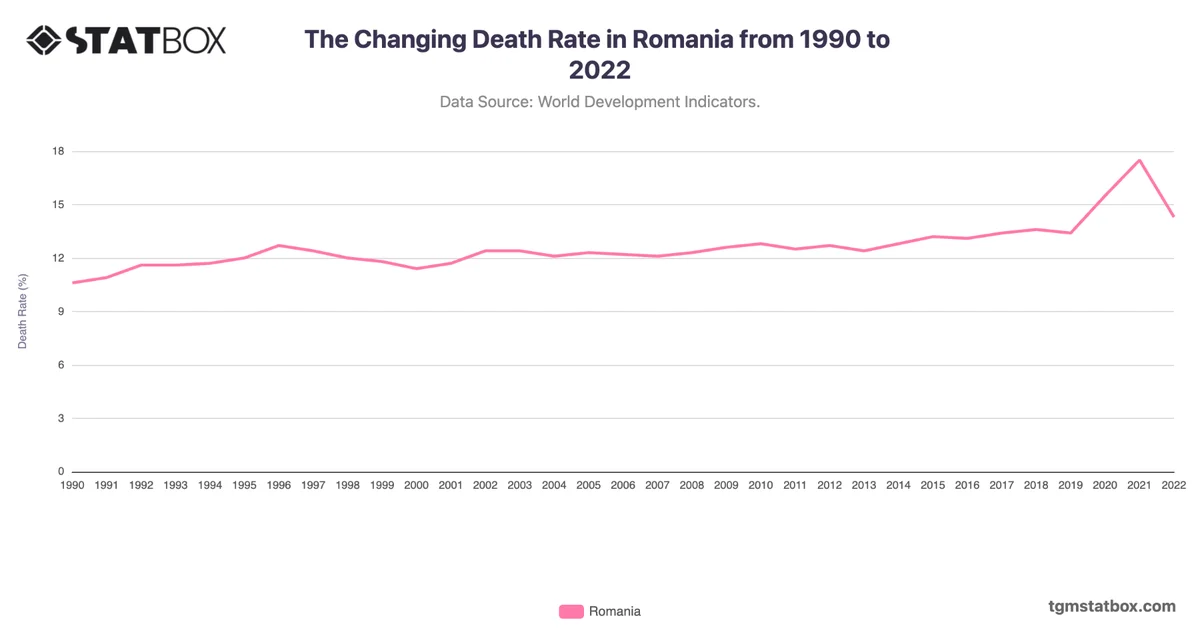
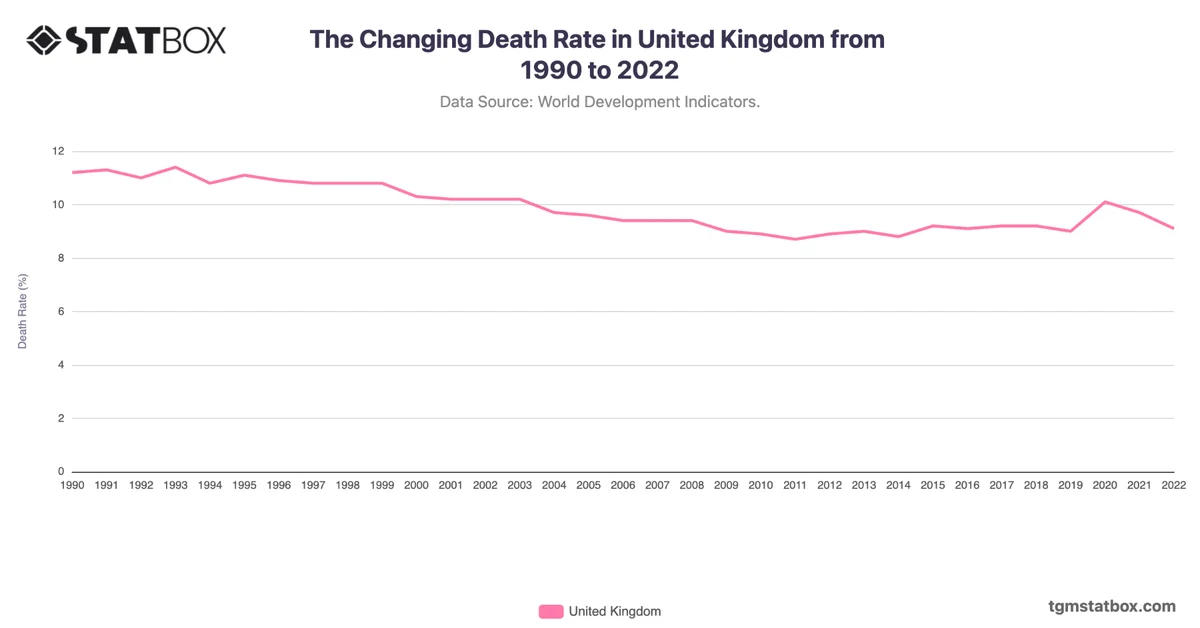
Explore related charts to gain a better understanding of Romania’s mortality trend, yearly GDP growth rate for Romania, Romania’s urbanization rate.