Serbia's central government debt has mirrored the country's economic and political challenges since 2005. Starting at 47.6% of GDP, debt decreased sharply to 26.75% by 2008, buoyed by economic growth and privatization revenues. However, the 2009 global financial crisis reversed this trend, with debt peaking at 69.96% in 2015 due to slower growth and rising fiscal deficits.
Following fiscal consolidation and structural reforms, debt began a downward trend, falling to 51.93% by 2019. The COVID-19 pandemic disrupted this progress, raising the debt ratio to 56.97% in 2020. Recovery efforts stabilized debt at 50.81% in 2022, reflecting improved fiscal management amid ongoing economic challenges.
Following fiscal consolidation and structural reforms, debt began a downward trend, falling to 51.93% by 2019. The COVID-19 pandemic disrupted this progress, raising the debt ratio to 56.97% in 2020. Recovery efforts stabilized debt at 50.81% in 2022, reflecting improved fiscal management amid ongoing economic challenges.
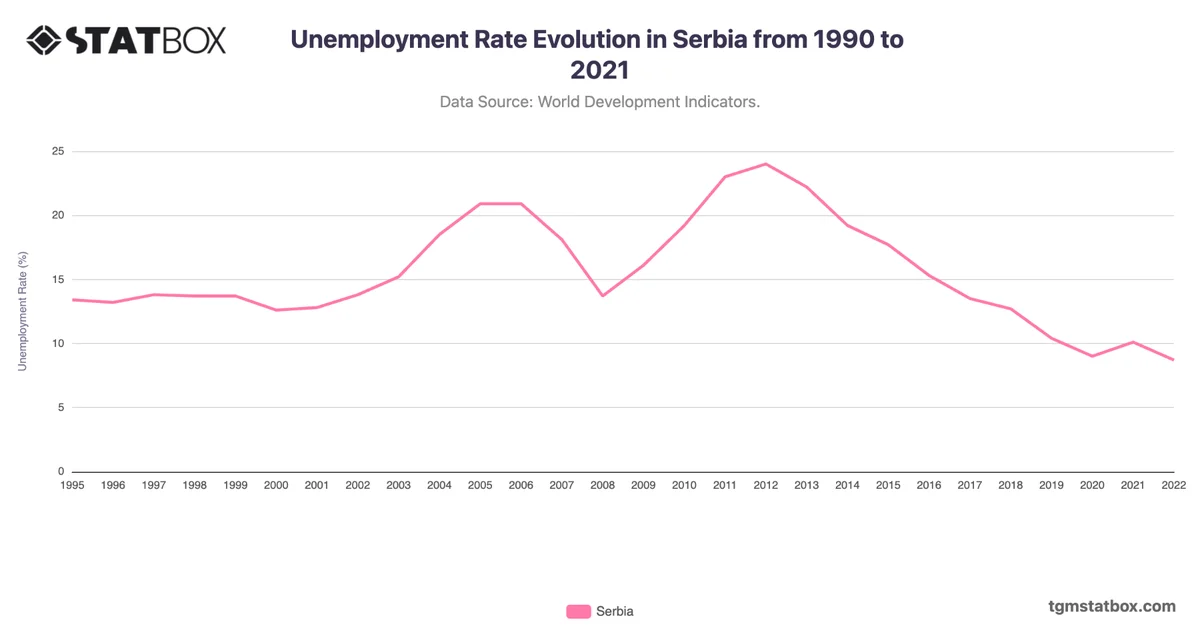
Gain a broader perspective by reviewing Serbia’s military spending, Serbia’s population growth data, Serbia’s unemployment rate.