The top 5 economies (United States, China, Germany, Japan, and India) account for a significant portion of global GDP, with the U.S. and China clearly leading the pack. The U.S. GDP alone is over $27 trillion, followed by China at around $17.8 trillion. This shows a large economic gap between the top two economies and the rest of the world, with Germany's GDP at less than $5 trillion.
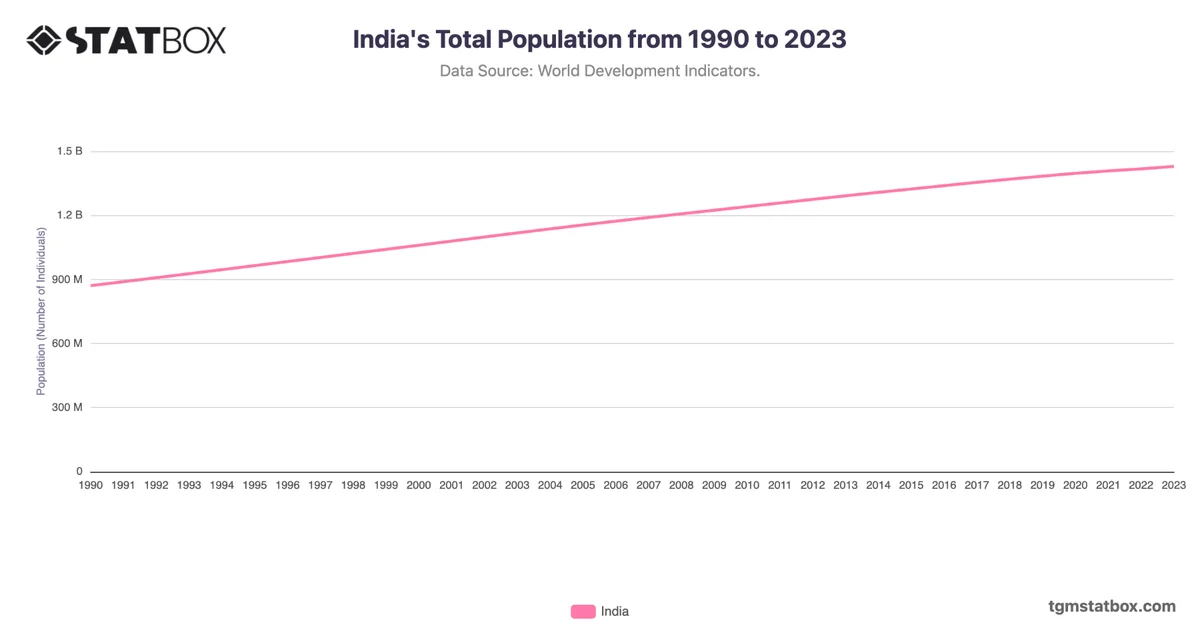
Asia has a strong presence in the top 20 economies with countries like China, Japan, India, and South Korea. India (5th) is ranked much higher than other countries with similar income levels, which is largely due to its vast population contributing to aggregate GDP.
Europe is represented by several high-income nations like Germany, the United Kingdom, France, Italy, and others, showing a strong economic influence in the region. Countries like Luxembourg (72nd) and Qatar (55th) may have relatively low rankings in terms of GDP but are known for having high GDP per capita due to small populations and concentrated wealth.
Latin America has fewer countries in the top 20, with Brazil being the largest, ranked 9th.
Several oil-rich nations like Saudi Arabia (19th), Russia (11th), and United Arab Emirates (29th) appear among the top 30 economies, reflecting the influence of natural resource wealth on their GDP figures.
Island nations such as Malta, Bahamas, and Samoa have relatively low GDPs, which may reflect their geographical limitations and small population sizes.
For additional information, visit statistics on