The Changing Death Rate in Serbia from 1990 to 2022

The Changing Death Rate in Serbia from 1990 to 2022

Share the statistic on social media channels or embed the statistic in your website using "Embed Code", where available.

Share chart

Embed chart
Select Citation

Cite this statistic and select one of the following formats: APA, Chicago, Harvard, MLA & Bluebook


  • APA
  • Chicago
  • Harvard
  • MLA
  • Bluebook
  • IEEE
TGM StatBox. (2024). The Changing Death Rate in Serbia from 1990 to 2022. TGM StatBox.
Chart Details
Timeframe: 1990-2022
Country: Serbia
Published date: 2024
Note: The death rate, as defined by World Development Indicators, measures the number of deaths in a given population during a specific time period, usually expressed as deaths per 1,000 individuals per year.
Key Takeaways
Serbia’s death rate rose steadily from 11.0 in 1990 to 14.6 by 2019, reflecting demographic aging and post-conflict challenges. The sharp increase to 20.0 in 2021 is attributed to the COVID-19 pandemic, which disproportionately affected elderly populations and strained healthcare systems.

By 2022, the rate dropped to 16.2, indicating recovery but still highlighting the demographic and health challenges Serbia faces due to its aging population and limited healthcare resources.

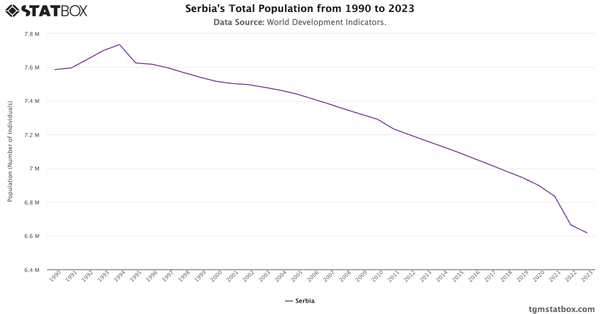
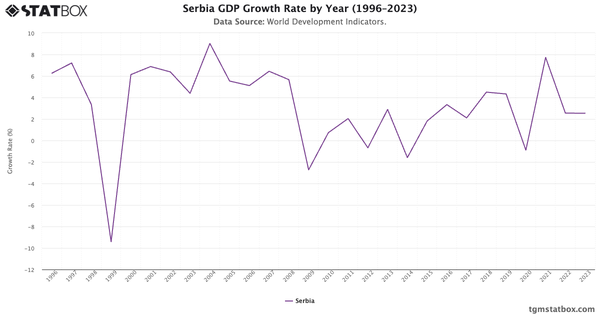
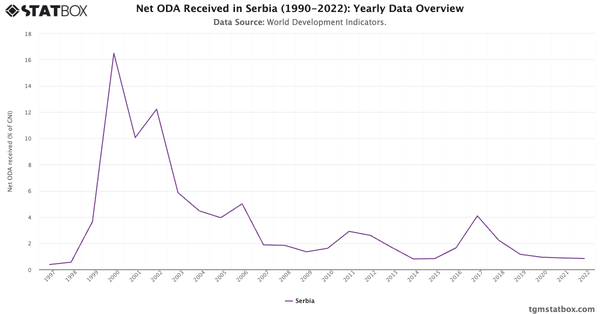
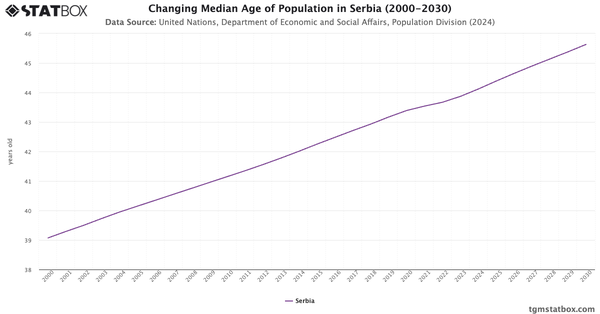
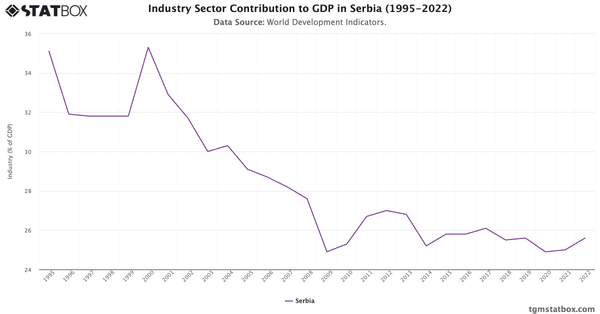
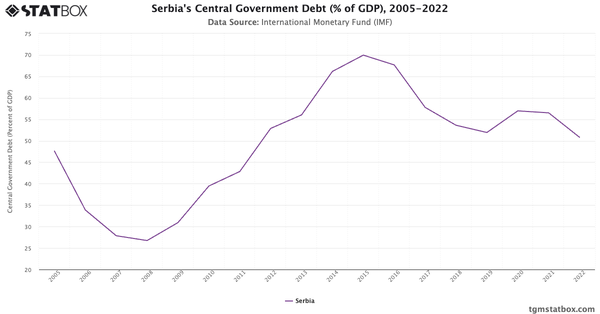
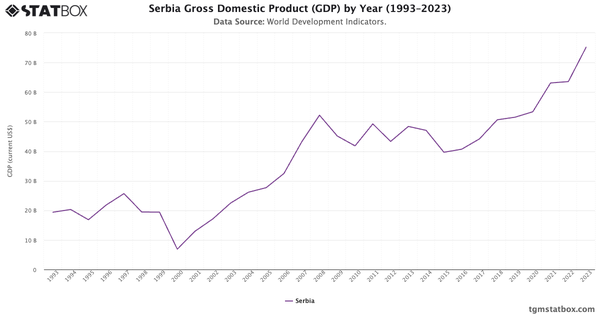
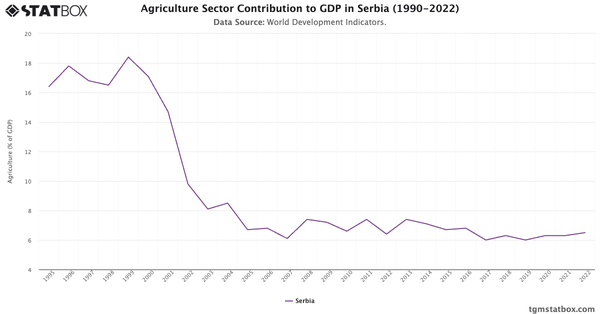
For a deeper dive into the topic, explore Serbia’s median age shift, Serbia’s annual GDP growth rate, agriculture’s GDP share in Serbia.

Further Recommended Statistics

Statbox vector
Statbox |form contact icon

Have Other Queries?

Statbox vector

Connect with our expert team for immediate assistance or comprehensive market analysis. We are always ready to support your business needs.