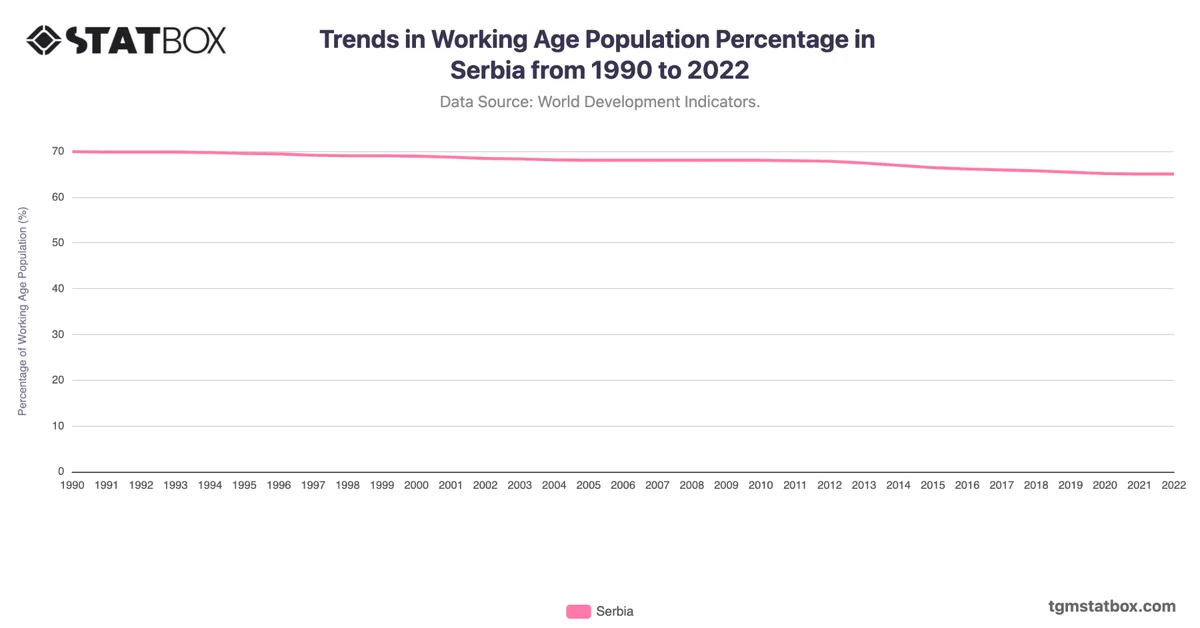
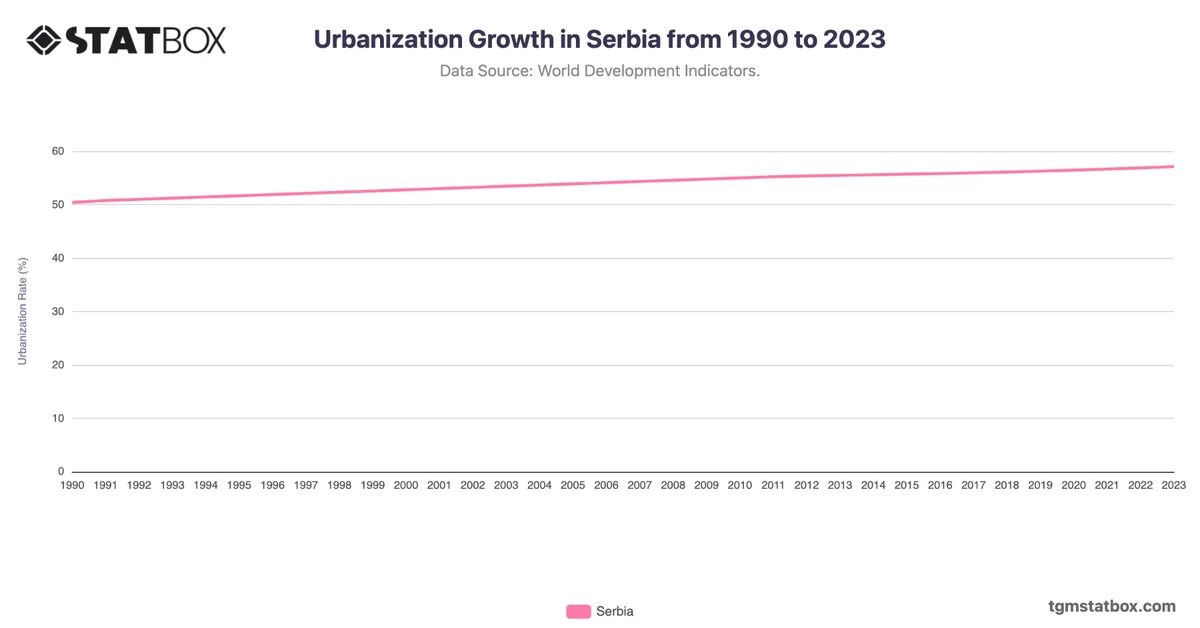
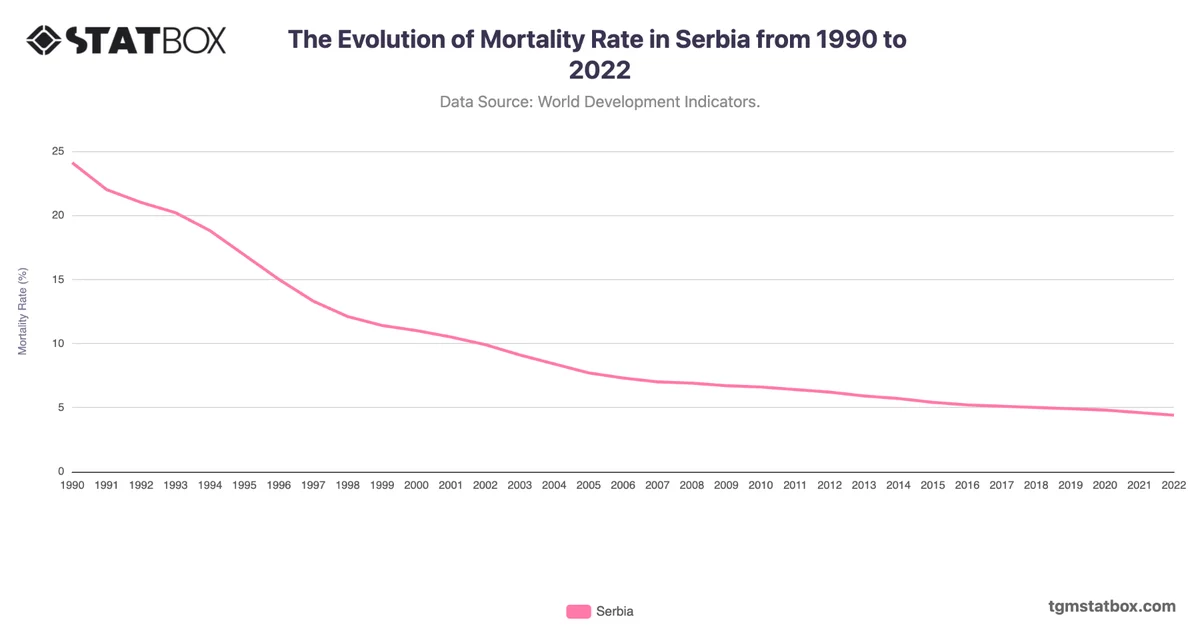
From 2006 onwards, Serbia’s population density showed a gradual decline, from 85 people per square kilometer to 81 by 2021. This decline reflects Serbia’s demographic challenges, including a low birth rate and significant emigration. Urban centers like Belgrade and Novi Sad remain relatively dense; however, rural areas experience population declines, resulting in an overall reduction in density.
The demographic trends in Serbia suggest a shift toward urban concentration in cities, while rural depopulation lowers national density. Serbia’s population policies and regional migration will likely continue to influence this density trend, with urbanization concentrated in key economic areas.
The demographic trends in Serbia suggest a shift toward urban concentration in cities, while rural depopulation lowers national density. Serbia’s population policies and regional migration will likely continue to influence this density trend, with urbanization concentrated in key economic areas.
Discover additional trends and data on Serbia’s median age shift, Serbia’s population numbers, Serbia’s net lending/borrowing as a share of GDP.