Share the statistic on social media channels or embed the statistic in your website using "Embed Code", where available.
Share chart
Embed chart Embed copied!Cite this statistic and select one of the following formats: APA, Chicago, Harvard, MLA & Bluebook
Key Takeaways
Singapore showcases a balanced digital ecosystem, with 48.75% using mobile devices and 48.45% on computers. This suggests a technologically advanced environment where both platforms are integral to daily life. The 2.79% tablet usage reflects a relatively minor presence in the overall device landscape.
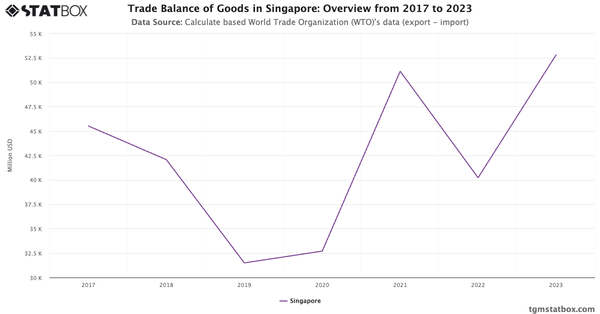
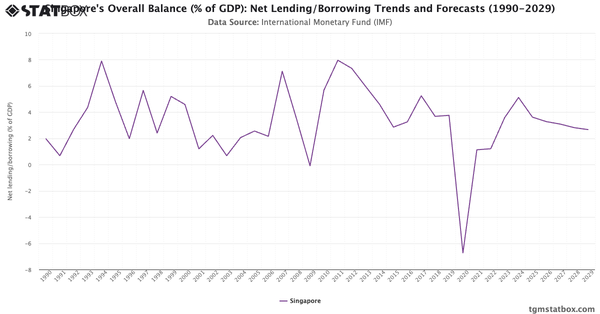
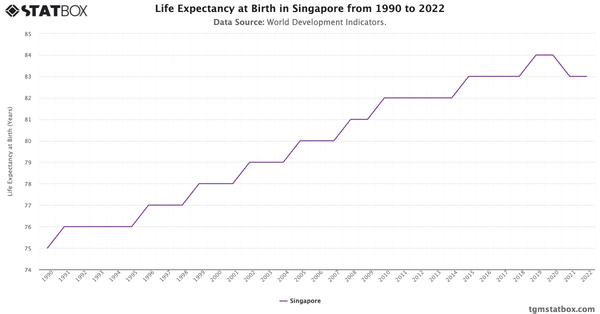
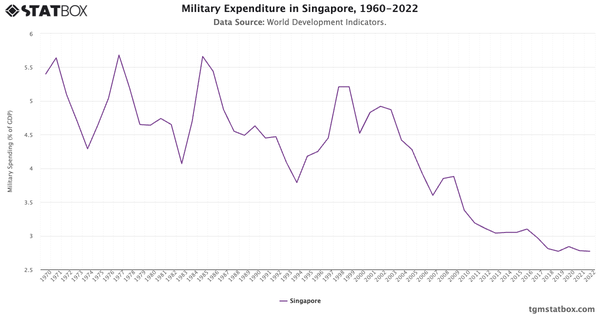
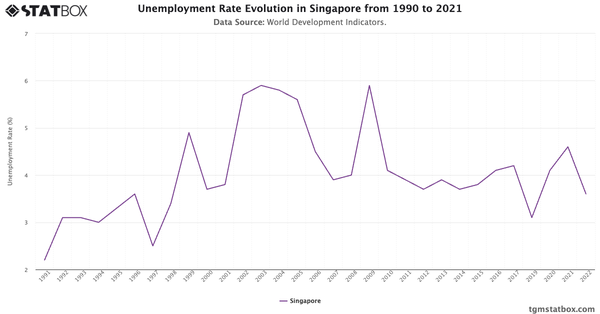
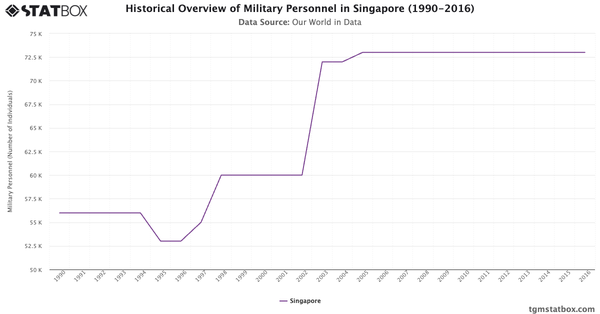
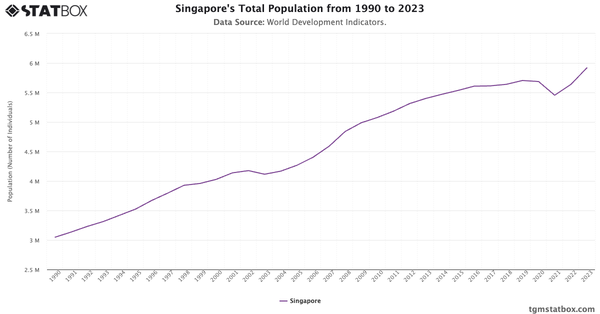
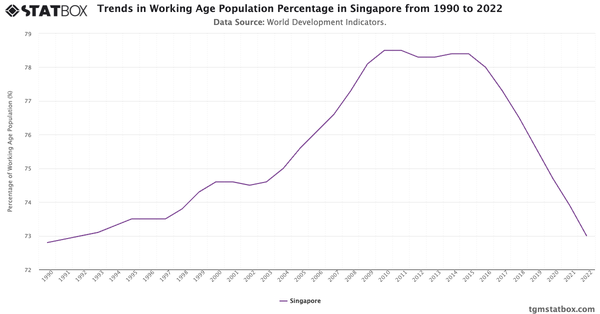
For additional information, visit statistics on Singapore’s working-age population share, Singapore’s defense spending, Singapore’s net lending/borrowing as a percentage of GDP.

Singapore Sustainability Insights Report 2024
Learn more about sustainability insights in Singapore with TGM StatBox. Explore in-depth insight report, featuring user behavior, trends, and preferences.
Go to report


Connect with our expert team for immediate assistance or comprehensive market analysis. We are always ready to support your business needs.