Switzerland GDP Growth Rate (1961–2023)
Switzerland’s GDP growth historically reflects a stable yet occasionally volatile economy, marked by external shocks and resilient recoveries. The early 1960s showcased strong expansion, peaking at 8.1% in 1961, supported by robust industrial output and global trade integration. However, the mid-1970s introduced a severe economic contraction, with a -7.3% decline in 1975, attributed to the global oil crisis and structural adjustments.
Recovery was slow but steady, with the 1980s featuring moderate gains despite the global recessionary backdrop. The 1990s experienced stagnation, exacerbated by the European economic downturn and currency pressures. Growth turned negative in the early 1990s, including a -0.9% rate in 1991, before stabilizing towards the millennium.
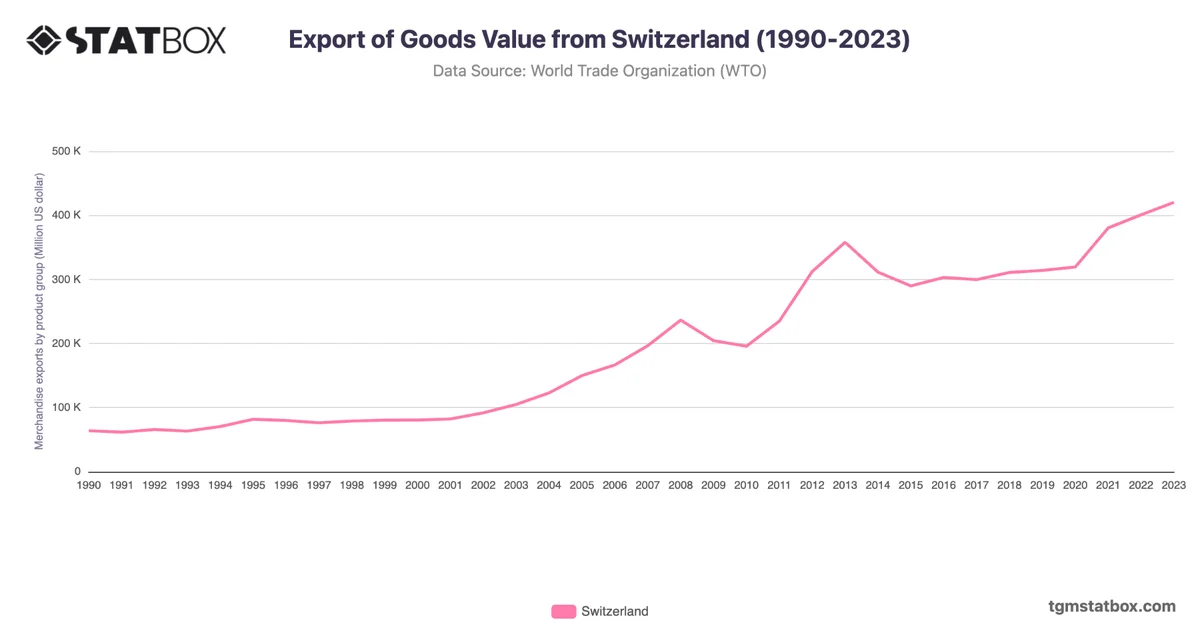
The 2008 financial crisis led to a -2.3% drop in 2009, followed by a swift recovery bolstered by Switzerland’s strong financial sector and export resilience. Despite challenges like the COVID-19 pandemic causing a -2.1% decline in 2020, recovery was swift, reaching 5.4% in 2021. Growth has since slowed, landing at 0.7% in 2023, amid global uncertainties and economic slowdowns across Europe.
Discover additional trends and data on Switzerland’s population trends, Switzerland’s government debt ratio, Switzerland’s manufacturing sector GDP share.