Switzerland has maintained low unemployment rates, supported by a robust economy and strong labor policies. Unemployment rose during the early 1990s, peaking at 4.1% in 1997, reflecting the global economic slowdown. Following this, the rate dropped to 2.7% by 2000, with stability in key industries like banking and manufacturing.
The global financial crisis and the COVID-19 pandemic caused periodic increases, with unemployment reaching 5.1% in 2021. Switzerland’s diversified economy and supportive government policies, however, helped reduce the rate to 4.3% by 2022, underscoring the resilience of its labor market in times of crisis.
The global financial crisis and the COVID-19 pandemic caused periodic increases, with unemployment reaching 5.1% in 2021. Switzerland’s diversified economy and supportive government policies, however, helped reduce the rate to 4.3% by 2022, underscoring the resilience of its labor market in times of crisis.
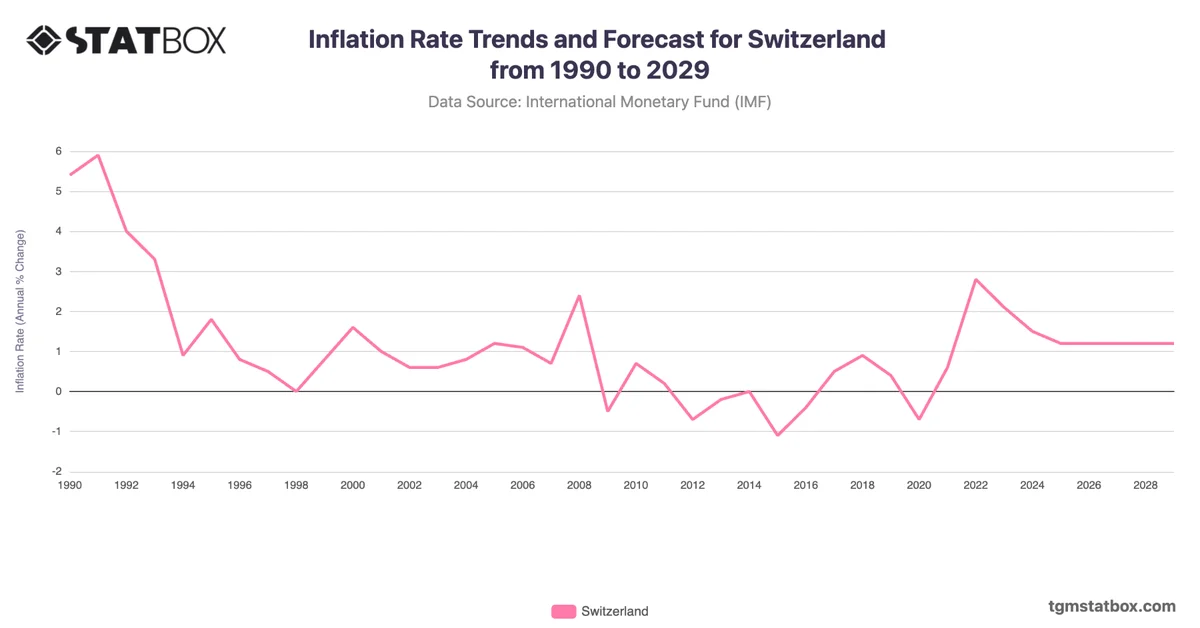
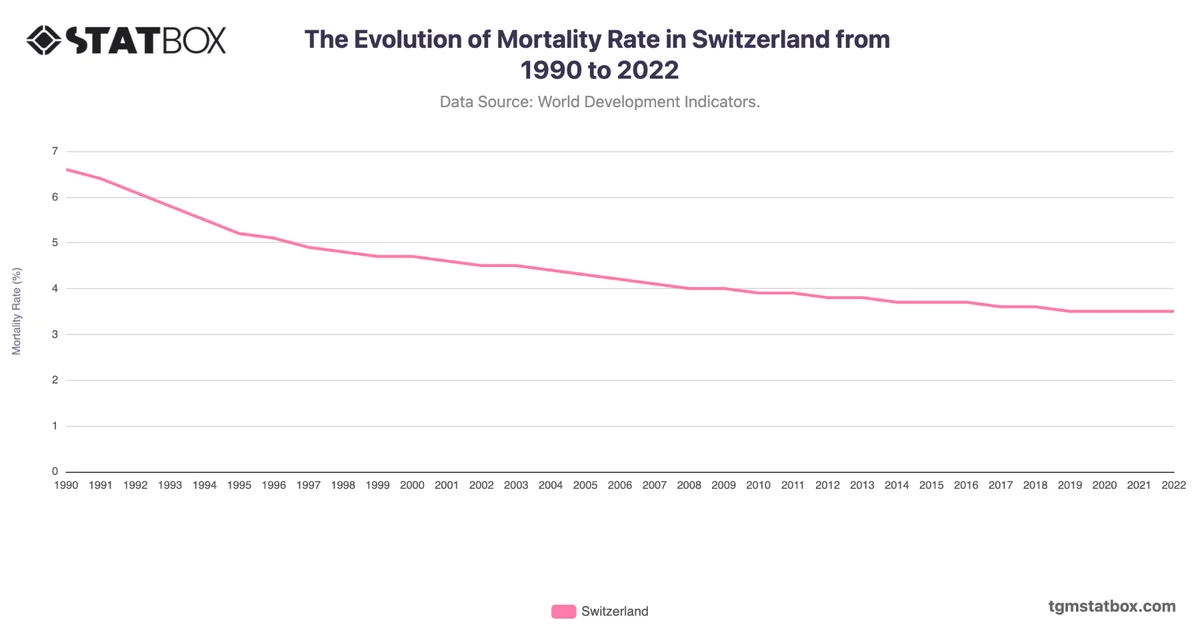
Discover additional trends and data on Switzerland’s government debt as a percentage of GDP, Switzerland’s inflation forecast, Switzerland’s mortality rate.