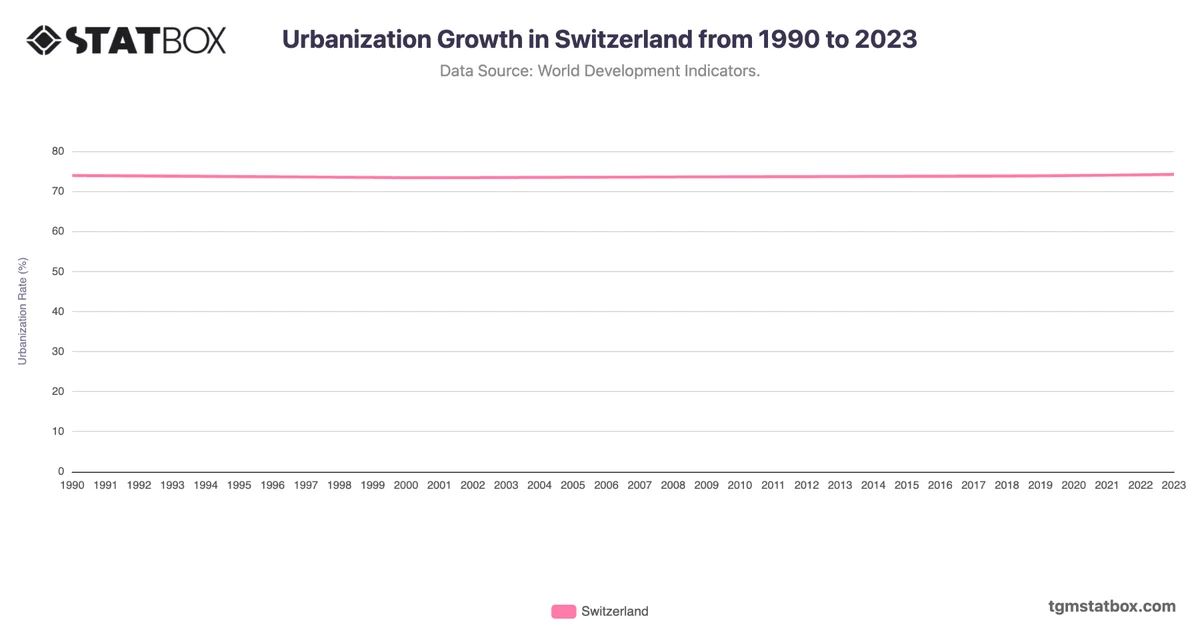
Switzerland’s fertility rate exhibited remarkable stability, remaining at or near 1.5 for most of the period between 1990 and 2022. The slight decrease from 1.6 in 1990 to 1.4 in 2002 was driven by increasing urbanization, higher living costs, and a focus on career advancement among younger generations.
Despite efforts to support working parents through childcare subsidies and flexible work arrangements, the rate plateaued at 1.5 from 2007 to 2020. The minor decline to 1.4 in 2022 reflects ongoing challenges, including housing affordability and shifts in societal priorities, emphasizing individual lifestyles over traditional family structures.
Despite efforts to support working parents through childcare subsidies and flexible work arrangements, the rate plateaued at 1.5 from 2007 to 2020. The minor decline to 1.4 in 2022 reflects ongoing challenges, including housing affordability and shifts in societal priorities, emphasizing individual lifestyles over traditional family structures.
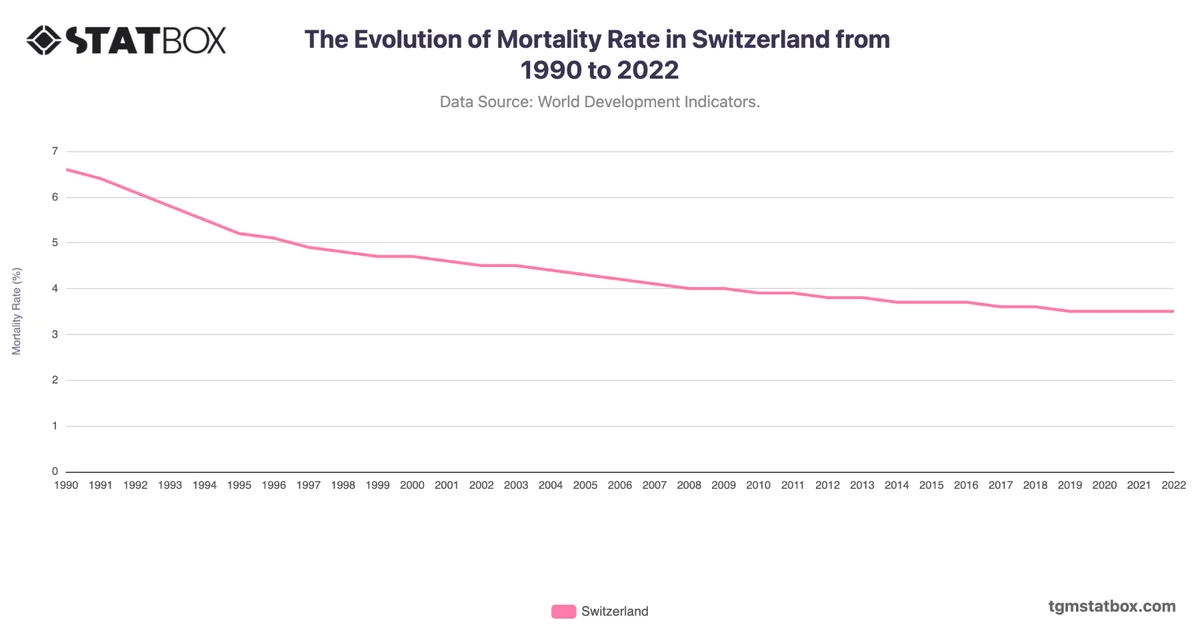
Gain a broader perspective by reviewing Switzerland’s net lending/borrowing as a percentage of GDP, Switzerland’s mortality rate, Switzerland’s population trends.