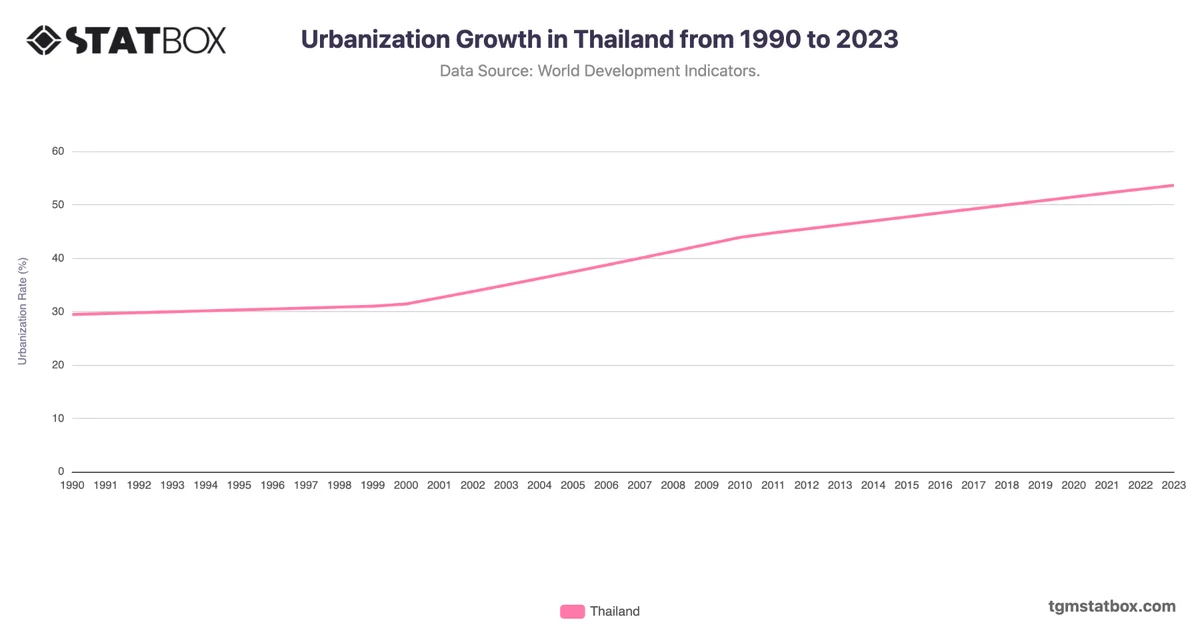
Thailand experienced a gradual decline in fertility rates from 2.1 in 1990 to 1.3 in 2022, highlighting the success of family planning initiatives and urbanization. The most significant drop occurred during the 1990s, reflecting nationwide campaigns promoting smaller families and increased access to contraceptives.
The plateau at 1.6 from 2000 to 2013 illustrates a period of stabilization, supported by improving education and healthcare systems. The continued decline to 1.3 by 2022 indicates ongoing societal shifts, including delayed marriages and a growing urban middle class opting for fewer children.
The plateau at 1.6 from 2000 to 2013 illustrates a period of stabilization, supported by improving education and healthcare systems. The continued decline to 1.3 by 2022 indicates ongoing societal shifts, including delayed marriages and a growing urban middle class opting for fewer children.
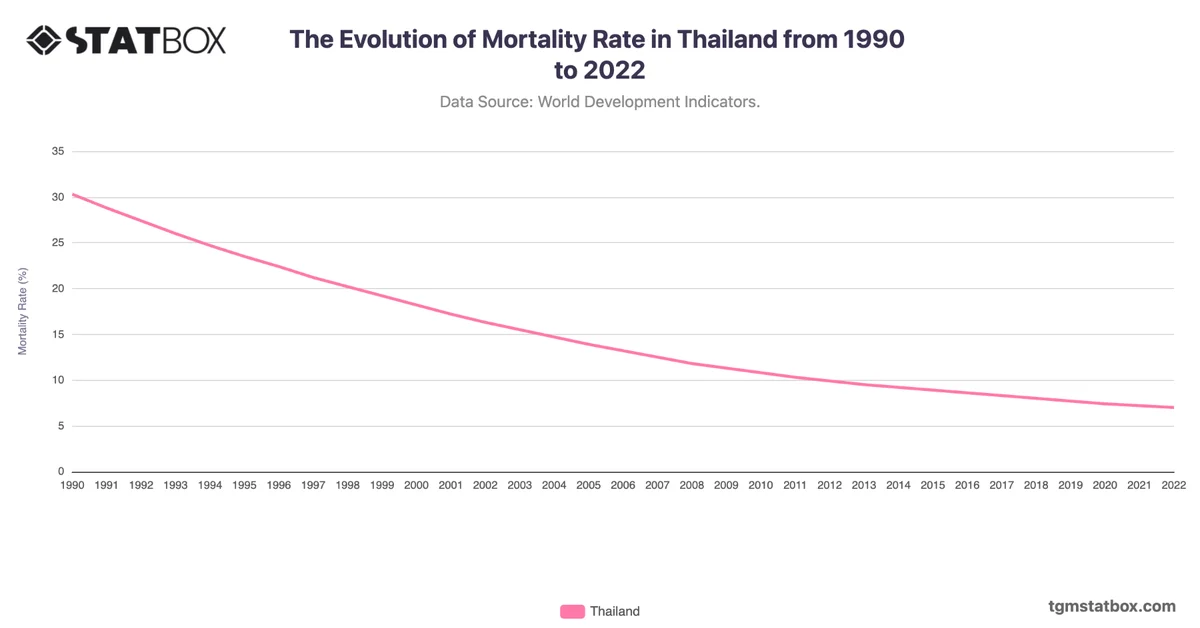
For a deeper dive into the topic, explore Thailand’s government debt share, Thailand’s population numbers, Thailand’s mortality rate changes.