Emotional Consistency and Gender Alignment in Pet Ownership Across APAC
The emotional relationship between pet owners and their pets is a distinct dimension of the human-animal bond that shapes how people integrate pets into daily life. Across APAC, understanding the emotional value pets provide is relevant to how brands, services, and communications position pet ownership within broader lifestyle and wellbeing contexts.
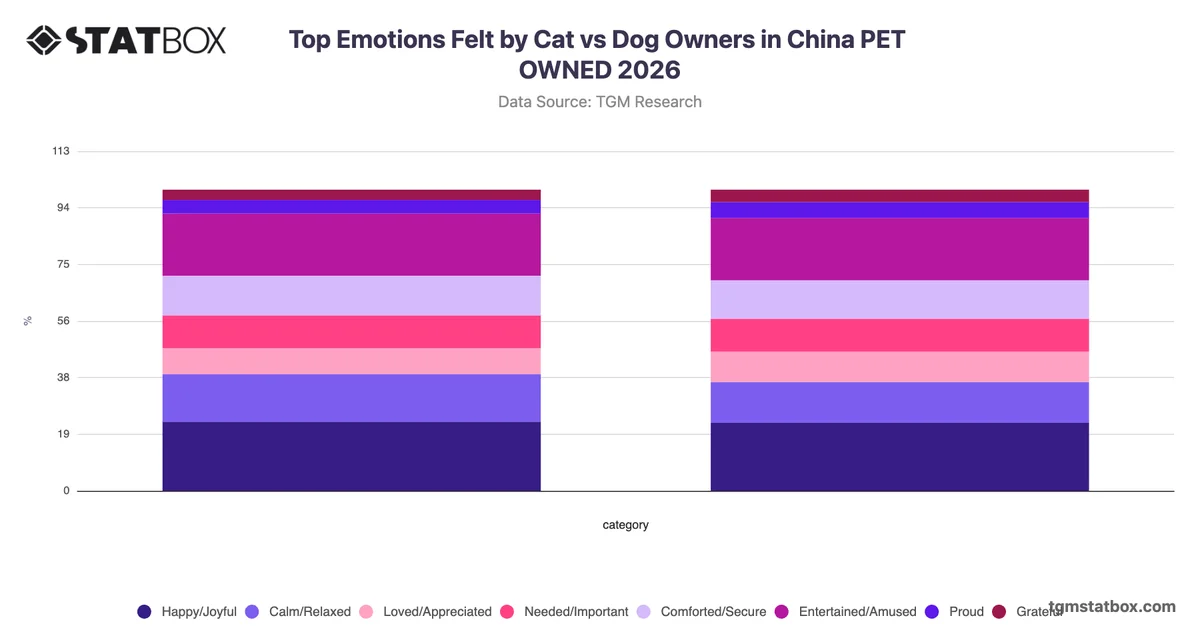
The most analytically notable pattern across APAC is the high degree of gender alignment in the emotions pets evoke, rather than meaningful divergence. Happiness remains the leading emotional response for both male and female pet owners, at 56% and 60% respectively, while comfort, calm, and entertainment cluster closely across both groups with differences of no more than two percentage points. This consistency suggests that the emotional value of pet ownership is broadly uniform regardless of gender, pointing to a shared psychological proposition rather than gender-segmented needs. The one area of modest distinction is entertainment: males index slightly higher here, while females lean marginally toward feeling loved and comforted. For organisations developing pet-related messaging or product positioning, this pattern indicates that gender-neutral emotional platforms centred on joy and comfort are likely to resonate broadly, while subtle secondary messaging around entertainment or connection could be tested for gender-specific refinement.