Unemployment Rate Evolution in Tunisia from 1990 to 2021

Unemployment Rate Evolution in Tunisia from 1990 to 2021

Share the statistic on social media channels or embed the statistic in your website using "Embed Code", where available.

Share chart

Embed chart
Select Citation

Cite this statistic and select one of the following formats: APA, Chicago, Harvard, MLA & Bluebook


  • APA
  • Chicago
  • Harvard
  • MLA
  • Bluebook
  • IEEE
TGM StatBox. (2024). Unemployment Rate Evolution in Tunisia from 1990 to 2021. TGM StatBox.
Chart Details
Timeframe: 1990-2023
Country: Tunisia
Published date: 2024
Note: The Unemployment Rate, as defined by World Development Indicators, is the percentage of the labor force that is without work but is actively seeking employment and available to start work.
Key Takeaways
Tunisia’s unemployment rate was high in the late 1990s, fluctuating around 15%, which is indicative of the challenges in labor market absorption despite gradual economic reforms. Efforts to diversify the economy saw a slight decline, with the rate reaching 12.4% in 2008. However, the 2011 revolution brought economic disruption, leading to a sharp increase in unemployment to 18.3%.

Since then, Tunisia has struggled with structural unemployment, especially among youth, and saw fluctuations around 15-17% from 2012 to 2019. The rate remained high due to political instability and slow economic recovery, reaching 15.1% in 2023. The high unemployment underscores ongoing economic and social challenges, as well as the need for sustainable job creation.

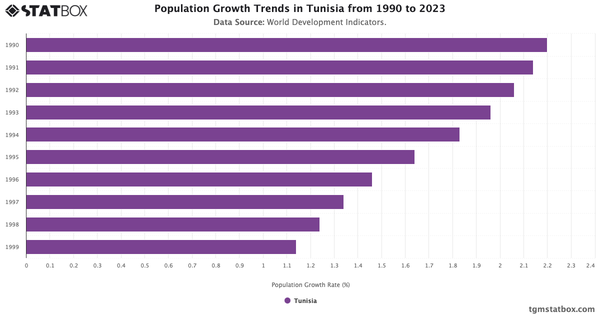
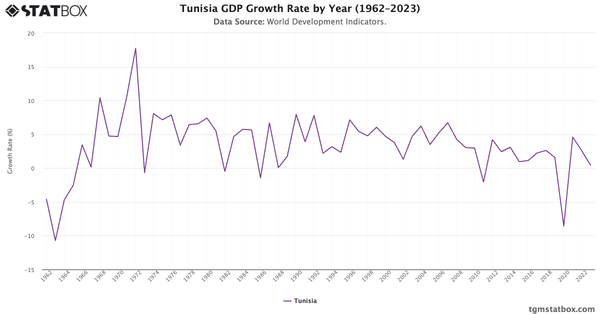
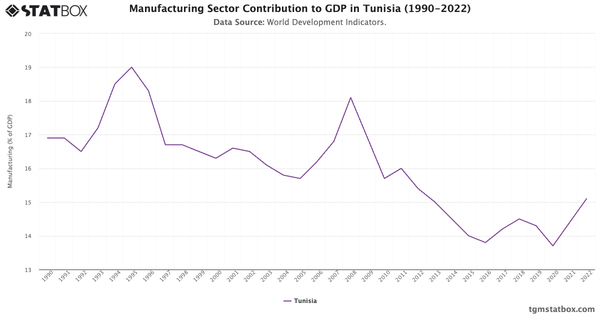
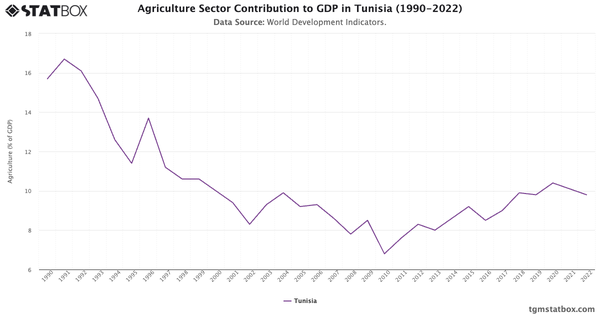
Find out more through related statistics on Tunisia’s annual GDP growth rate, Tunisia’s fertility rate pattern, Tunisia’s manufacturing sector share in GDP.

Further Recommended Statistics

Statbox vector
Statbox |form contact icon

Have Other Queries?

Statbox vector

Connect with our expert team for immediate assistance or comprehensive market analysis. We are always ready to support your business needs.