Tunisia’s export of goods value has experienced steady growth from 1990 through 2023, though marked by significant periods of volatility. In the 1990s, exports began at 3.5 billion USD in 1990 and grew to 5.5 billion USD by 1997, reflecting Tunisia’s gradual integration into global markets and its expanding manufacturing sector. The 2000s saw stronger growth, with exports reaching 10.5 billion USD in 2005, largely driven by textiles, chemicals, and machinery exports. However, the 2008 global financial crisis caused a significant slowdown, with exports dropping to 14.4 billion USD in 2009.
The years following the 2011 revolution marked a period of transition, with Tunisia’s export value reaching a high of 17.8 billion USD in 2011 before fluctuating around 16-17 billion USD over the next few years. The slow pace of post-revolutionary economic reforms and political instability affected export growth during this time. However, by 2021, exports rebounded, hitting 16.7 billion USD, and continued upward, reaching 18.6 billion USD in 2022 and 19.99 billion USD in 2023. Despite external challenges, Tunisia’s export growth reflects its resilience and the gradual diversification of its export markets.
The years following the 2011 revolution marked a period of transition, with Tunisia’s export value reaching a high of 17.8 billion USD in 2011 before fluctuating around 16-17 billion USD over the next few years. The slow pace of post-revolutionary economic reforms and political instability affected export growth during this time. However, by 2021, exports rebounded, hitting 16.7 billion USD, and continued upward, reaching 18.6 billion USD in 2022 and 19.99 billion USD in 2023. Despite external challenges, Tunisia’s export growth reflects its resilience and the gradual diversification of its export markets.
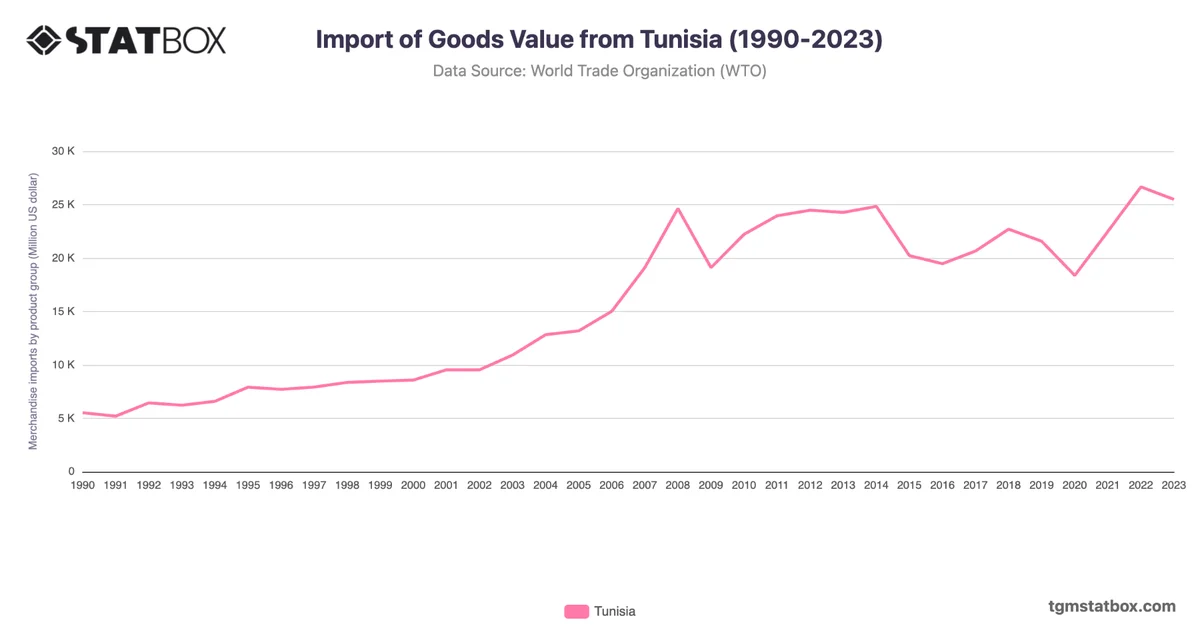
Find out more through related statistics on Tunisia’s import value, Tunisia’s population growth, Tunisia’s agricultural sector share in GDP.