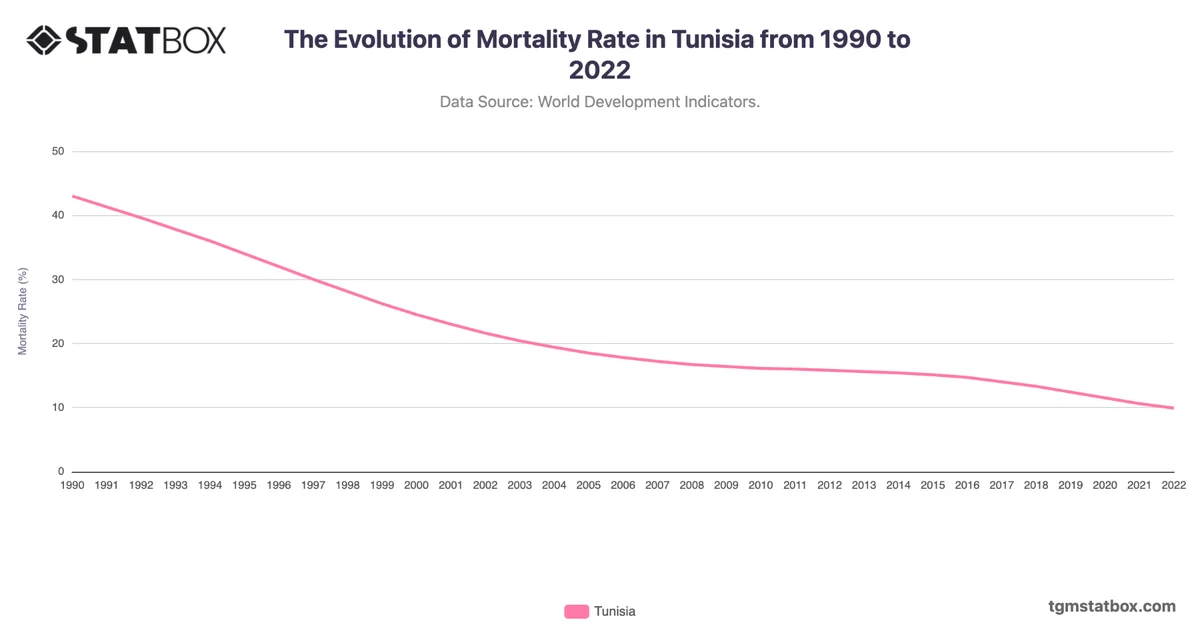
Tunisia's death rate steadily decreased from 5.5 in 1990 to 4.7 in 1999, reflecting improvements in public health and economic development. However, from the early 2000s, the death rate gradually increased, reaching 6.1 in 2019. This trend is linked to demographic shifts, particularly an aging population.
The spike to 7.9 in 2021 reflects the impact of the COVID-19 pandemic, which caused a significant increase in mortality rates. By 2022, the death rate dropped to 7.6, signaling recovery, though the underlying aging trend suggests sustained higher rates in the future.
The spike to 7.9 in 2021 reflects the impact of the COVID-19 pandemic, which caused a significant increase in mortality rates. By 2022, the death rate dropped to 7.6, signaling recovery, though the underlying aging trend suggests sustained higher rates in the future.
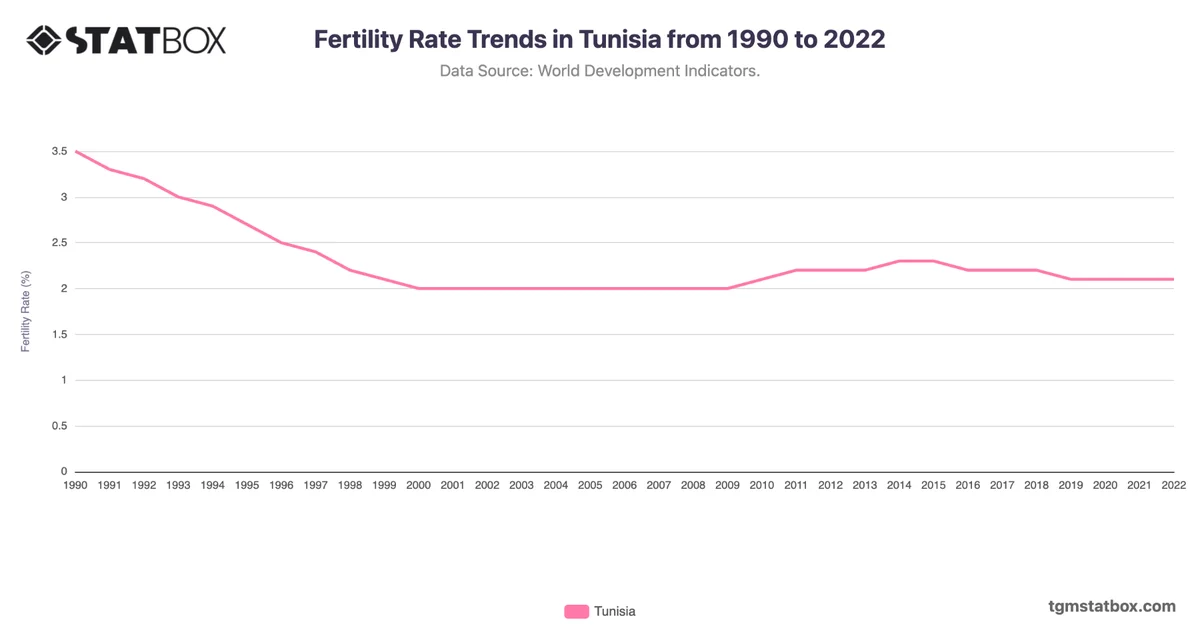
Gain a broader perspective by reviewing Tunisia’s mortality rate trend, Tunisia’s population growth, Tunisia’s fertility rate pattern.