Tunisia's fertility rate fell sharply from 3.5 in 1990 to 2.0 by 2000, showcasing the impact of education reforms, economic growth, and family planning programs. This significant decline marks Tunisia’s demographic transition toward a modern society.
Between 2000 and 2022, the fertility rate stabilized around 2.0, reflecting sustained policy efforts and cultural shifts. The slight uptick in the early 2010s to 2.3 may relate to temporary social or economic influences, but the rate normalized to 2.1 by 2022, underlining Tunisia's consistent demographic patterns.
Between 2000 and 2022, the fertility rate stabilized around 2.0, reflecting sustained policy efforts and cultural shifts. The slight uptick in the early 2010s to 2.3 may relate to temporary social or economic influences, but the rate normalized to 2.1 by 2022, underlining Tunisia's consistent demographic patterns.
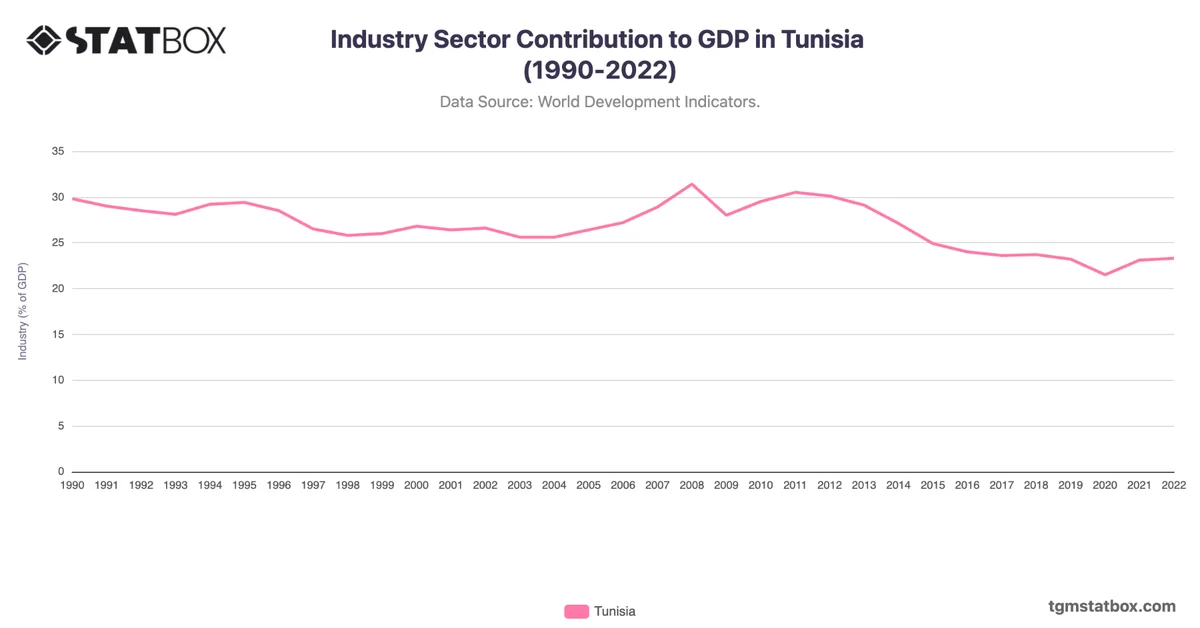
Explore related charts to gain a better understanding of Tunisia’s manufacturing sector share in GDP, Tunisia’s manufacturing sector share in GDP, Tunisia’s agricultural sector share in GDP.