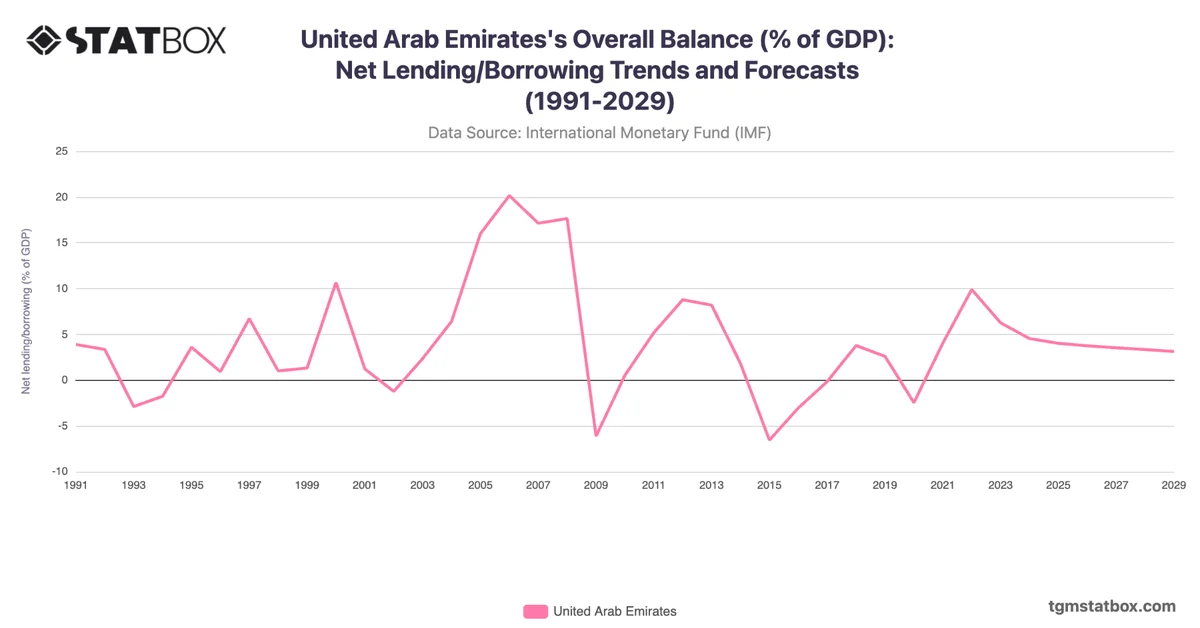
The UAE maintained relatively low levels of government debt from 1990 through the early 2000s, with debt-to-GDP ratios consistently under 10%. During this period, strong oil revenues allowed the UAE to fund government initiatives without substantial borrowing. Debt began to rise modestly in 2007, reaching 8.9%, due to increased infrastructure investment to support economic diversification and tourism ahead of the 2008 financial crisis.
The debt ratio peaked at 21.5% in 2011 following the global economic downturn and a period of slowed growth. Subsequently, debt levels remained manageable, hovering around 15-20% until 2019, when oil price volatility prompted further increases. The impact of COVID-19 caused a sharp spike to 41.1% in 2020 as the UAE responded with economic support measures. By 2022, debt decreased to 30.0% as oil prices recovered and economic activities resumed.
The debt ratio peaked at 21.5% in 2011 following the global economic downturn and a period of slowed growth. Subsequently, debt levels remained manageable, hovering around 15-20% until 2019, when oil price volatility prompted further increases. The impact of COVID-19 caused a sharp spike to 41.1% in 2020 as the UAE responded with economic support measures. By 2022, debt decreased to 30.0% as oil prices recovered and economic activities resumed.
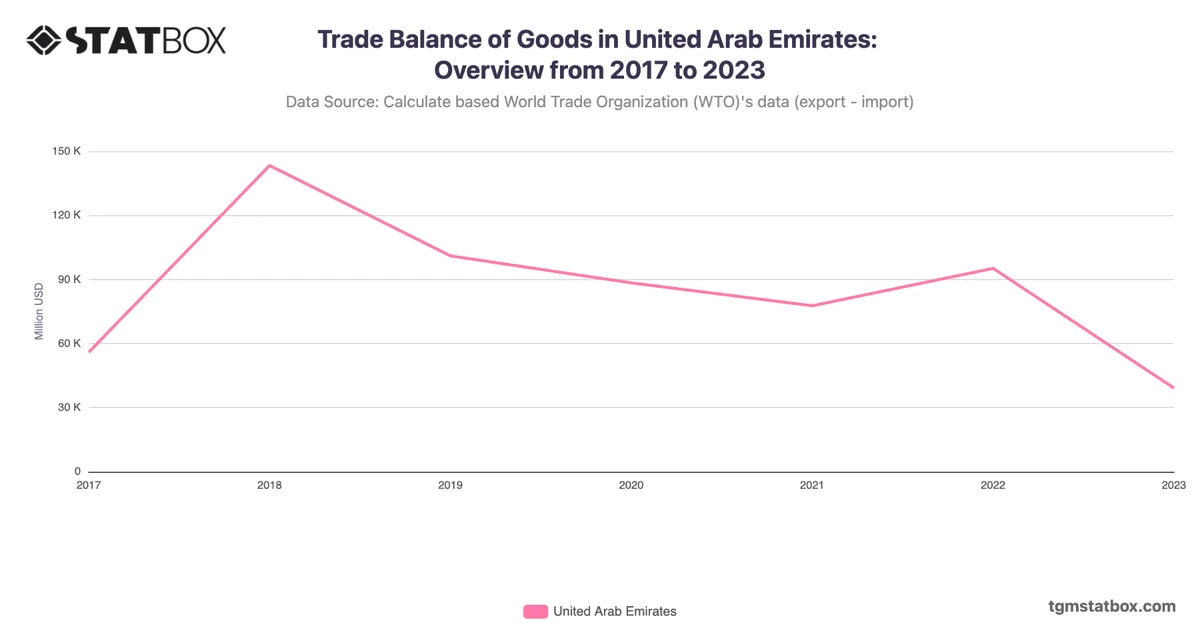
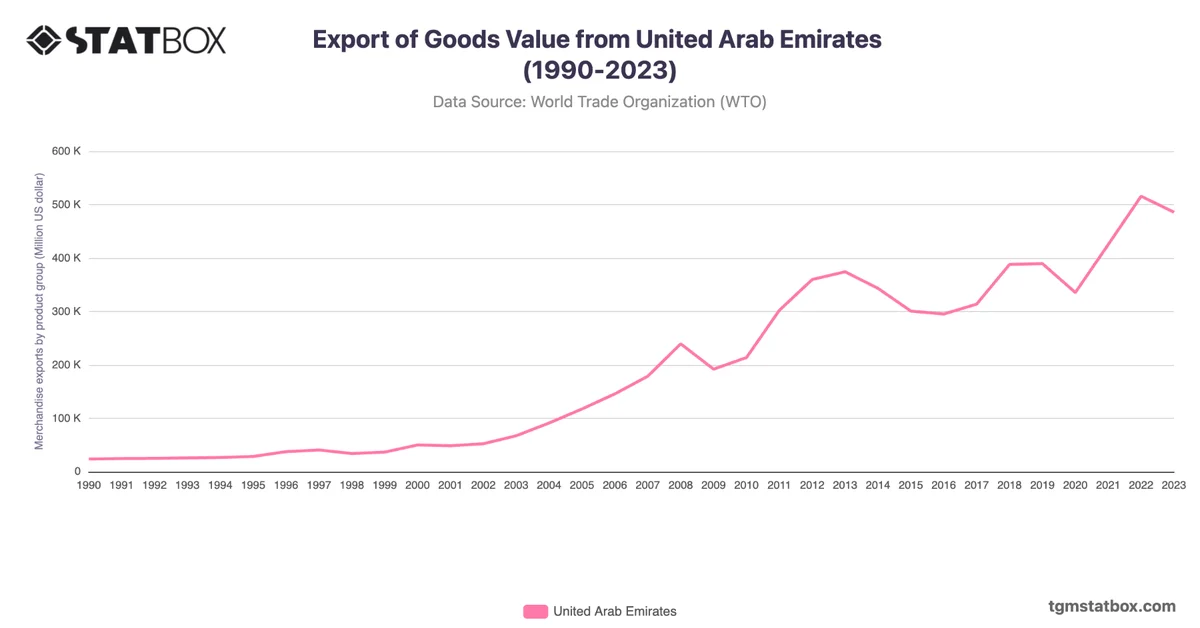
Discover additional trends and data on UAE’s industry sector share in GDP, UAE trade goods balance, United Arab Emirates export value.