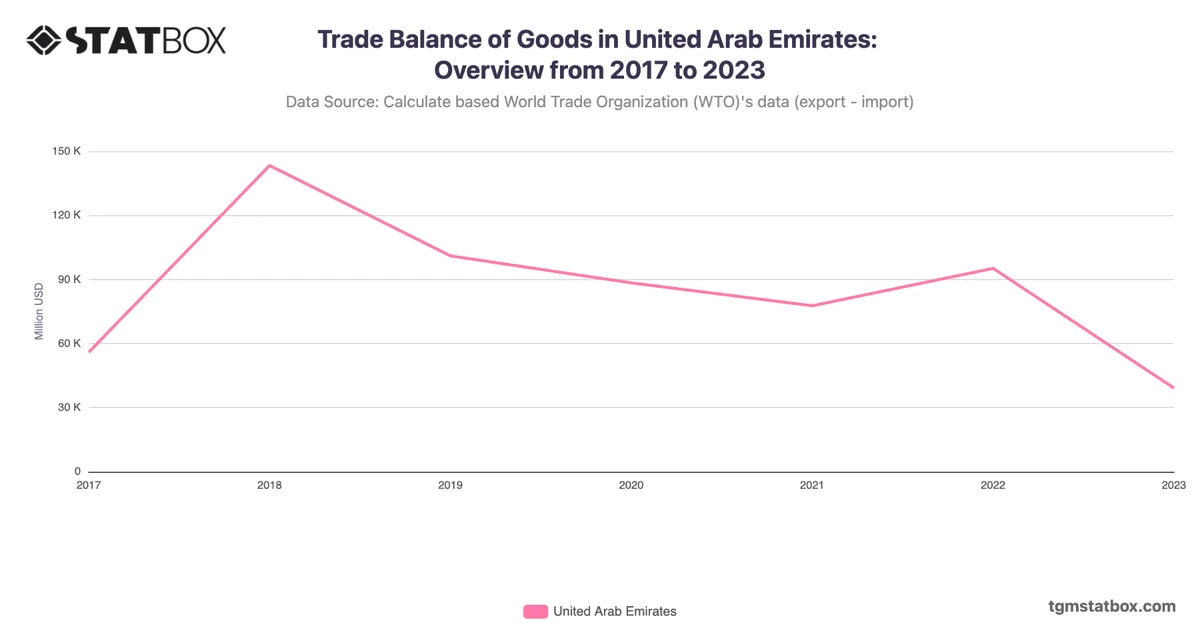
The United Arab Emirates (UAE) has experienced exponential growth in its export value from 1990 to 2023, driven primarily by its oil exports and expanding non-oil sectors. In 1990, the country’s export value stood at 23.5 billion USD, and by the mid-1990s, exports had increased to 37.3 billion USD in 1996, reflecting the UAE’s growing oil revenues. The boom continued into the 2000s, with exports surging to 90.9 billion USD in 2004, as the country leveraged its oil wealth to diversify its economy and enhance trade routes, particularly through Dubai’s position as a global trade hub.
The global financial crisis led to a temporary slowdown in 2009, with exports dropping to 191.8 billion USD, but recovery was swift. By 2011, exports soared to 302 billion USD, driven by rising oil prices and increasing demand for non-oil exports, including metals, machinery, and chemicals. The UAE’s export growth continued unabated in the following decade, peaking at 515.6 billion USD in 2022, underpinned by its strategic investments in infrastructure and global trade partnerships. The country’s exports in 2023 slightly decreased to 485.7 billion USD, reflecting global economic uncertainties. Despite this, the UAE remains a leading exporter in the region, with its diversified export portfolio playing a key role in sustaining growth.
The global financial crisis led to a temporary slowdown in 2009, with exports dropping to 191.8 billion USD, but recovery was swift. By 2011, exports soared to 302 billion USD, driven by rising oil prices and increasing demand for non-oil exports, including metals, machinery, and chemicals. The UAE’s export growth continued unabated in the following decade, peaking at 515.6 billion USD in 2022, underpinned by its strategic investments in infrastructure and global trade partnerships. The country’s exports in 2023 slightly decreased to 485.7 billion USD, reflecting global economic uncertainties. Despite this, the UAE remains a leading exporter in the region, with its diversified export portfolio playing a key role in sustaining growth.
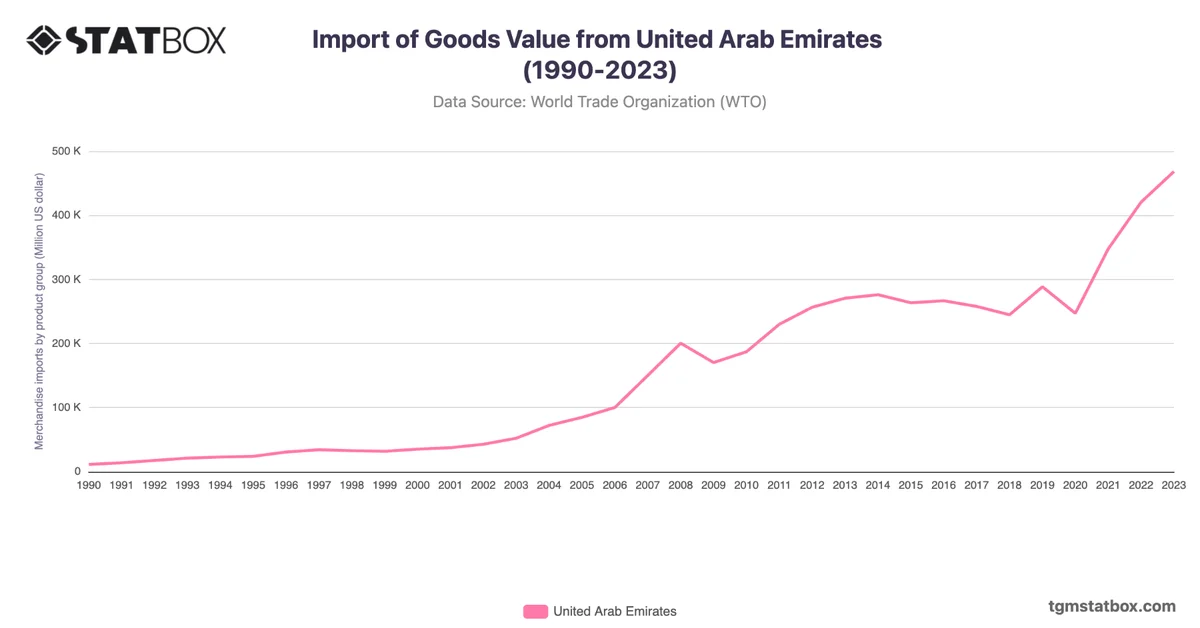
For a broader context, visit other statistics on value of imports from UAE, United Arab Emirates’ annual GDP growth rate, United Arab Emirates’ agriculture share in GDP.