Charts library
Not sure where to start? Dive into a diverse selection of charts and data visualizations across topics, and find the information you need to drive your research and analysis.
 Pro
Pro
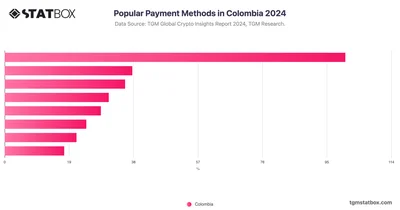
In Colombia, paying with cash is still the most common choice, more than half of people prefer it whenever they can. That said, digital payments are starting to pick up.
 Pro
Pro
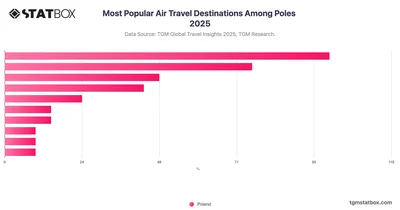
Polish travelers in 2025 shift toward Western Europe, while Southern Europe and Balkans remain favorites for culture, food, and warm getaways.
 Pro
Pro
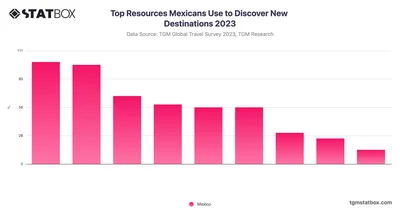
In Mexico, websites of travel companies are the most commonly used source for discovering new destinations, with 36% of respondents relying on them.
 Pro
Pro
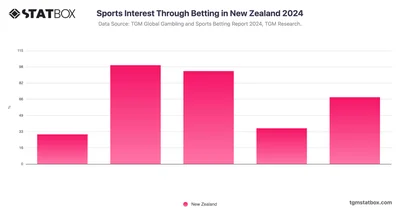
Sports Interest Through Betting in New Zealand | TGM Statbox Chart: Analyze how New Zealanders' sports interest connects with betting via TGM Statbox's chart.
 Pro
Pro
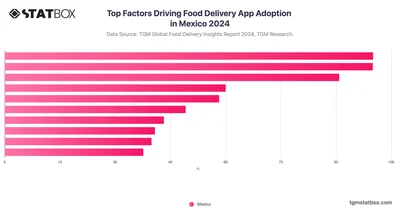
The main reasons people use food delivery apps are practical—avoiding cooking and saving time—along with satisfying cravings (30.3%) and accessing promotions.
 Pro
Pro
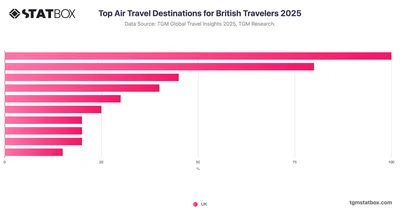
Western and Central Europe lead 2025 UK flight plans, as British travelers favor nearby, budget-friendly destinations post-Brexit. Full data on TGM StatBox.
 Pro
Pro
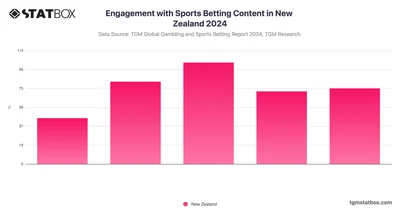
Engagement with Sports Betting Content in New Zealand | TGM Statbox Chart: Explore the level of engagement with sports betting content in New Zealand through TGM Statbox.
 Pro
Pro
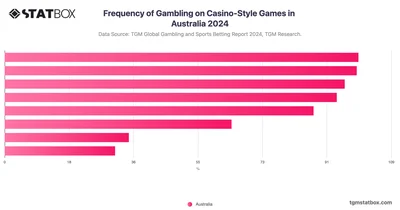
While a small percentage (5.8%) gamble every day, the majority of Australians engage in this activity less regularly. About 14.4% gamble a few times a week.
 Pro
Pro
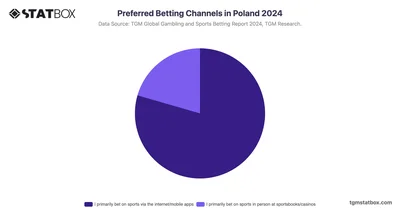
Preferred Betting Channels in Poland | TGM Statbox Chart: See the most preferred betting channels in Poland with TGM Statbox's informative chart.
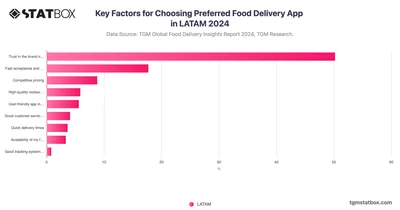
What drives food delivery app preferences in LATAM? At the top is brand trust, cited by over half of LATAM users (50.2%) as the most important factor.
 Pro
Pro
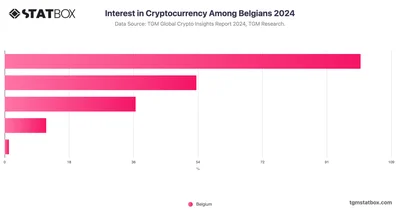
55% of Belgians have no interest in cryptocurrency, while a significant portion remains skeptical, showing a need for education to bridge gaps in trust and understanding.
 Pro
Pro
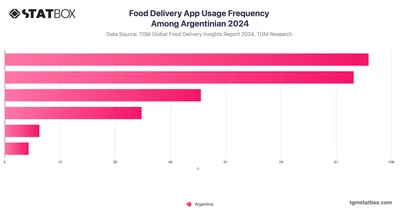
More than half of Argentinians use food delivery apps at least once a week. The convenience these apps offer has made them an integral part of daily life.
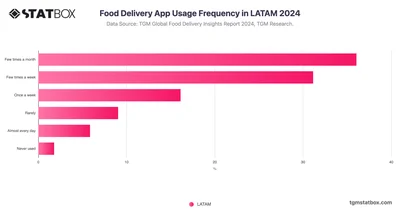
In LATAM, food delivery app usage is fairly regular, with nearly 53% of respondents using them at least once a week—the most common frequency being a few times a week.
 Pro
Pro
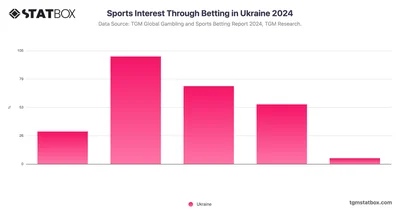
Understand how sports interest is shaped by betting activities in Ukraine, showcasing trends in sports betting preferences and engagement.
 Pro
Pro
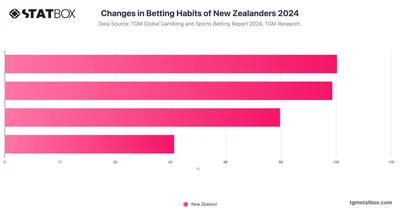
Changes in Betting Habits of New Zealanders | TGM Statbox Chart: Learn about the changing betting habits of New Zealanders with TGM Statbox's comprehensive chart.
 Pro
Pro
A majority of French bettors prefer online or mobile betting for its convenience, while 33.6% value the social experience of in-person venues.
 Pro
Pro
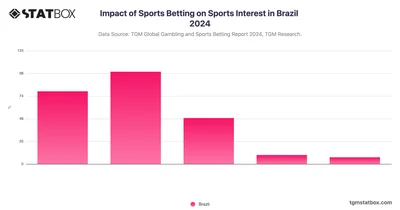
In Brazil, a large portion of sports bettors, 72.78%, agree that sports betting makes them more interested in following sports, with 32.07% strongly agreeing.
 Pro
Pro
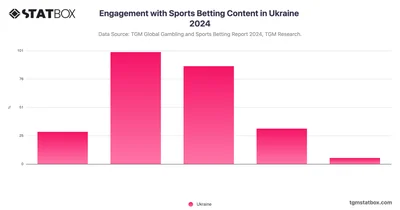
Explore the level of engagement Ukrainians have with sports betting content, from media consumption to online interactions, in this TGM Statbox chart.
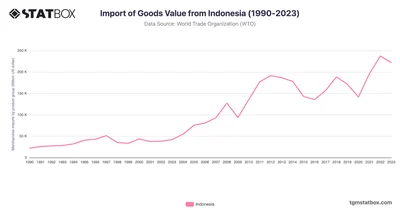
Indonesia’s imports rose from $21.8B in 1990 to $237.4B in 2022, driven by energy and industrial demand. Discover more statistics and insights on TGM StatBox.
 Pro
Pro
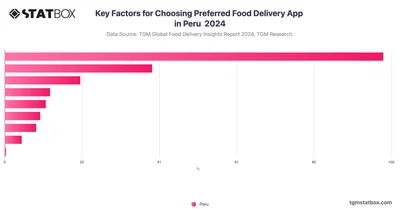
Nearly half of users (48.95%) choose their preferred app based on trust in the brand—more than double the next most important factor.
 Pro
Pro
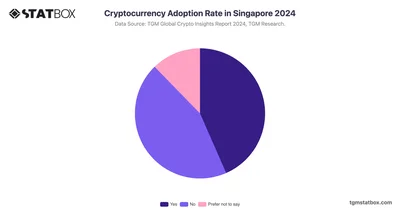
43.4% of respondents in Singapore have owned or used cryptocurrency, showing that nearly half of the population has at least engaged with digital currencies.
 Pro
Pro
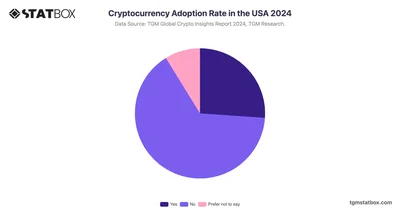
26% of respondents have owned or used cryptocurrency. While adoption is on the rise, it is still limited to just over a quarter of the population.
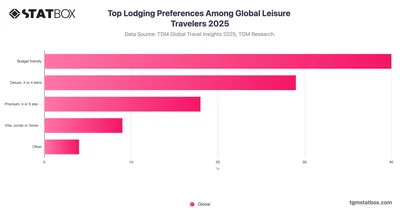
Budget and mid-range lodging top global travel in 2025, as value-conscious choices outpace luxury and rental options. Full data on TGM StatBox.
 Pro
Pro
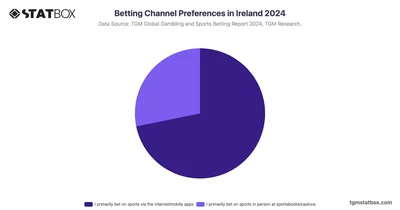
The betting landscape in Ireland is clearly shifting towards digital platforms, with 71.8% of respondents preferring to place their sports bets online or through mobile apps.
 Pro
Pro
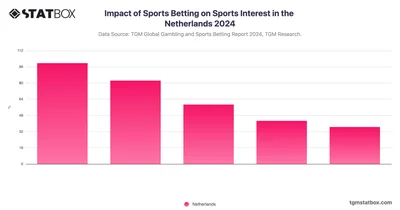
Sports betting has a mixed impact in the Netherlands, with 37% agreeing it boosts interest in following sports, but many remain neutral or disagree.
 Pro
Pro
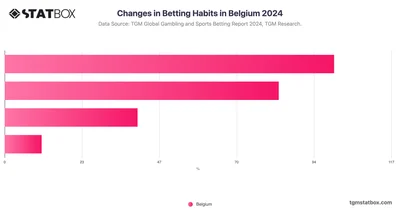
In Belgium, most people report stable or reduced betting habits, with 42.6% betting the same, 35.44% betting less, and only 17.18% betting more.
 Pro
Pro
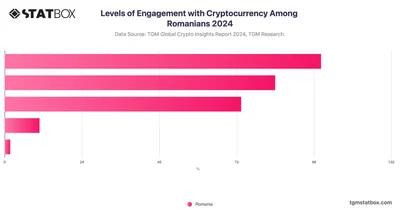
30.6% of Romanians want to learn about cryptocurrency, while remain a siginificant portion remains uninterested, showing both potential for adoption and a major engagement challenge.
 Pro
Pro
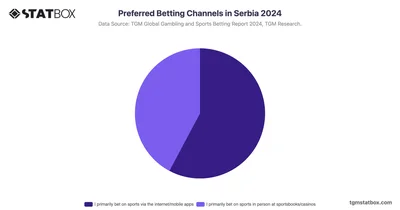
Explore preferred betting channels in Serbia with TGM Statbox Charts. Discover insights into the dominance of online, mobile, and land-based betting options.
 Pro
Pro
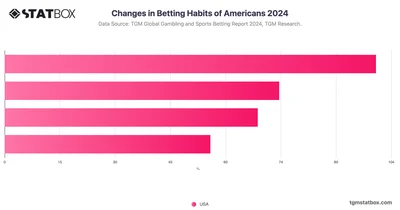
Track changes in betting habits among Americans, focusing on shifts in preferences and activities over time with this TGM Statbox chart.
 Pro
Pro
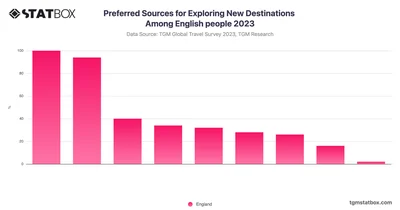
Websites of travel companies emerge as the most favored choice, with 50% of respondents utilizing them for information. Following closely are Trip Advisor and Instagram.






