Charts library
Not sure where to start? Dive into a diverse selection of charts and data visualizations across topics, and find the information you need to drive your research and analysis.
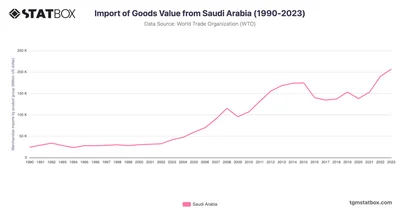
Saudi Arabia’s imports grew from $24B in 1990 to $206.9B in 2023, highlighting energy and consumer demand. Discover more statistics and insights on TGM StatBox.
 Pro
Pro
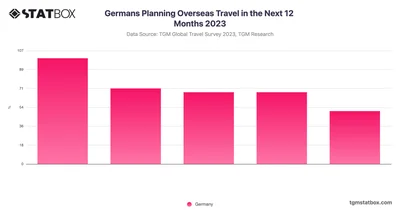
13.93% of Germans are very likely to travel overseas for leisure in the next 12 months. This is significantly lower compared to other countries like Saudi Arabia and UAE.
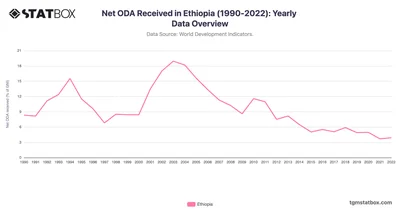
Ethiopia’s Net ODA peaked at 18.9% in 2003, declining to 5% by 2020 as economic growth progressed. Discover more insights on TGM StatBox.
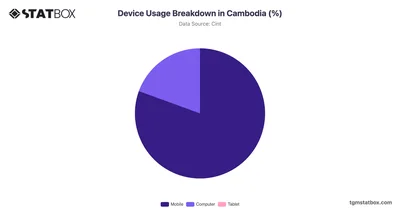
Cambodia leads with 80.56% of its population using mobile devices. Discover more about device usage breakdown in Cambodia, now on TGM StatBox.
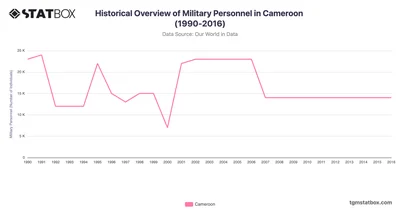
Cameroon experienced fluctuations in military personnel, reflecting both regional security challenges and economic factors. Discover more statistics on TGM StatBox.
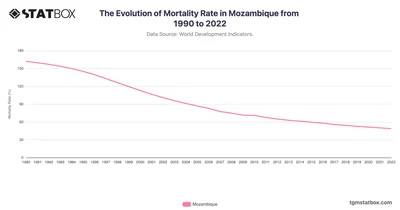
Mozambique’s mortality rate dropped significantly from 162 in 1990 to 48.7 in 2022, reflecting progress in disease control. Discover more statistics on TGM StatBox.
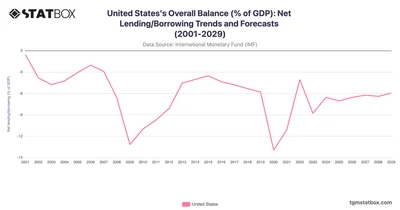
The US faces persistent fiscal deficits, reflecting long-term challenges and recovery efforts. Discover more statistics and insights on TGM StatBox.
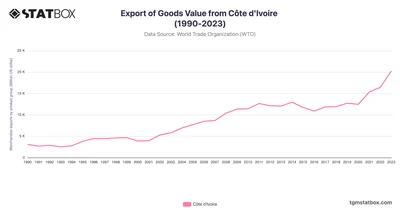
Delve into Côte d'Ivoire's export trends from 1990 to 2023, led by cocoa and rubber industries. Discover more statistics and insights on TGM StatBox.
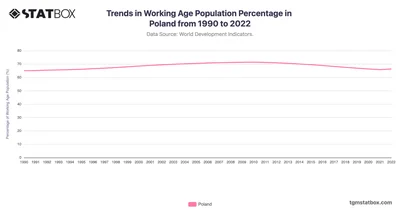
Poland's working-age population rose from 65% in 1990 to a peak of 71.4% in 2010 before beginning a steady decline, reaching 66.3% in 2022. Learn more on StatBox
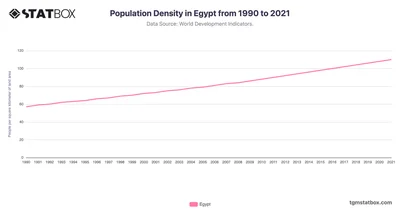
Egypt’s population density rose significantly, from 57 to 110 people per square kilometer. See the full Egypt’s population density data on TGM StatBox.
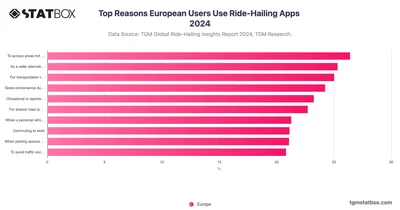
In Europe, users turn to ride-hailing applications for various practical reasons, with convenience and accessibility being the most prominent.
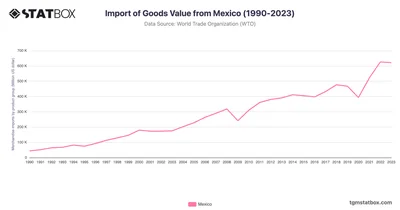
Mexico’s imports climbed from $43.5B in 1990 to $626.3B in 2022, reflecting industrial and consumer growth. Discover more statistics and insights on TGM StatBox.
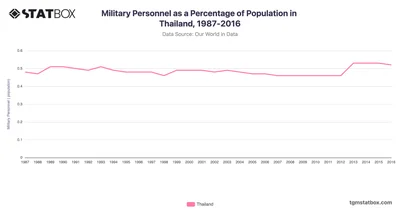
Thailand’s military personnel as a percentage of population remained relatively stable. Discover data on Thailand’s military personnel share on TGM StatBox.
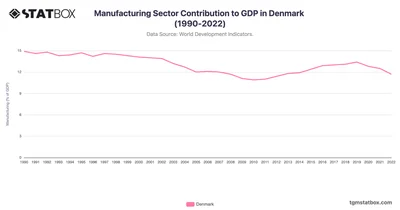
Denmark's manufacturing contribution started at 14.9% in 1990, with modest fluctuations throughout the decade. See more Denmark's data on TGM StatBox.
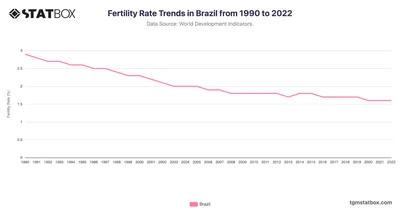
Examine Brazil's fertility trends from 1990 to 2022, showcasing population shifts driven by policy and cultural factors. Discover more statistics and insights on TGM StatBox.
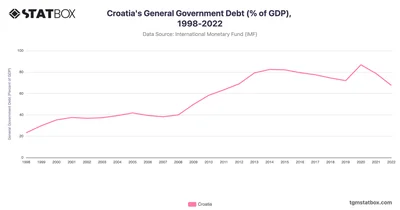
Croatia’s government debt began at a relatively moderate level in 1998, at 23.2%, but increased sharply in the early 2000s. Discover more statistics on TGM StatBox.
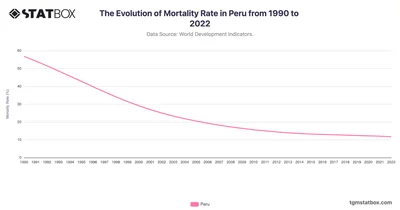
Peru’s mortality rate dropped from 56.8 in 1990 to 11.7 in 2022, reflecting public health improvements and disease prevention. Discover more insights on TGM StatBox.
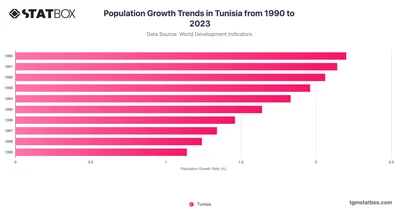
Dive into Tunisia’s population growth trends, shaped by economic transitions. Discover more statistics and insights in your target country on TGM StatBox.
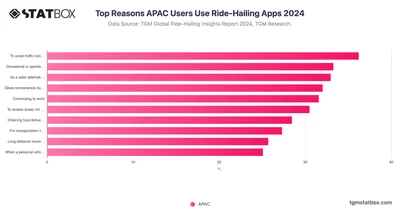
In APAC, 36.2% of users rely on ride-hailing to avoid traffic congestion, while a slightly smaller group use it for occasional or spontaneous travel needs.
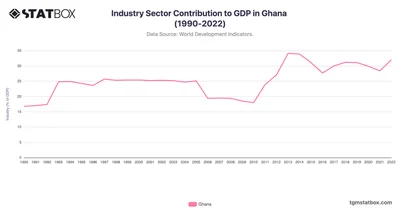
Ghana’s industrial sector contribution rose substantially from 16.8% in 1990, peaking at 34.1% in 2013. Find more data about Albania on TGM StatBox.
 Pro
Pro
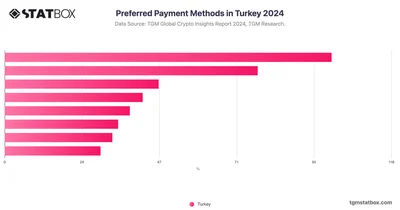
Cash remains the most popular payment method in Turkey, with 42.3% of respondents stating they prefer to pay with cash as often as they can.
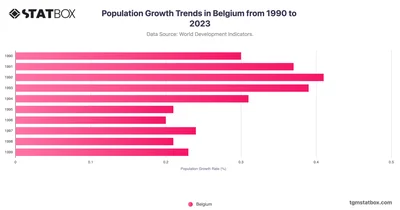
Analyze Belgium’s population trends, reflecting urban expansion and demographic shifts. Discover more statistics and insights in your target country on TGM StatBox.
 Pro
Pro
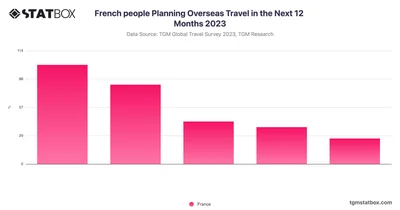
Over 60% of French respondents express a likelihood of traveling overseas for leisure, with 35.06% indicating they are "very likely."
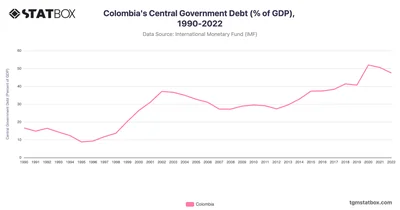
Colombia’s debt peaked at 51.96% in 2020, easing to 47.47% by 2022 amid fiscal adjustments. Learn more statistics and insights on TGM StatBox.
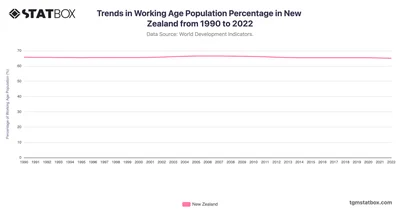
New Zealand’s working-age population remained relatively stable from 1990, starting at 65.7%. Discover the complete data on New Zealand's population on TGM StatBox.
 Pro
Pro
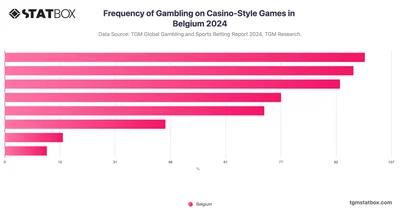
Most people in Belgium do not gamble regularly on casino-style games, with the majority betting infrequently. 15.01% gamble a few times a week, and just 2.29% do so daily.
 Pro
Pro
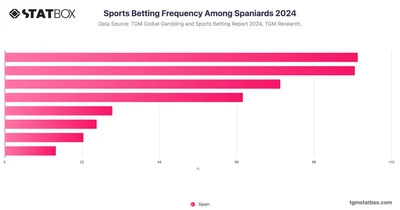
Discover how frequently Spaniards engage in sports betting, offering insights into their betting habits and trends with this TGM Statbox chart.
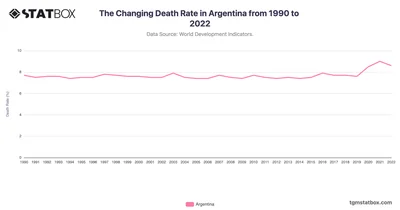
Explore Argentina's death rate evolution, influenced by health advancements and demographic factors. Discover more statistics and insights on TGM StatBox.
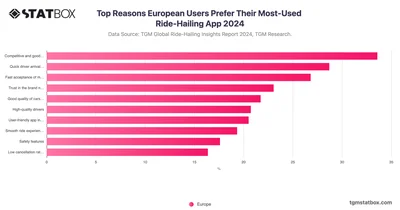
European users prioritize several key factors when choosing their most-used ride-hailing app. 33.6% choose their app primarily for its competitive and attractive pricing.
 Pro
Pro
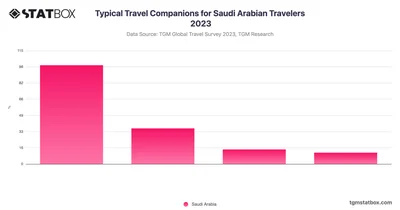
61% of Saudi Arabian travelers typically journey with family. This trend aligns with broader Middle Eastern values that emphasize togetherness and shared experiences.






