Charts library
Not sure where to start? Dive into a diverse selection of charts and data visualizations across topics, and find the information you need to drive your research and analysis.
 Pro
Pro
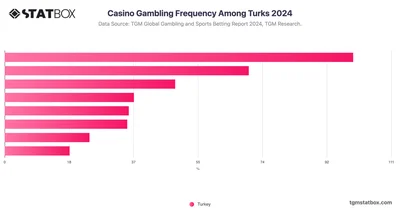
Analyze the frequency of casino gambling among Turks with this TGM Statbox chart, offering data on the popularity of casino activities.
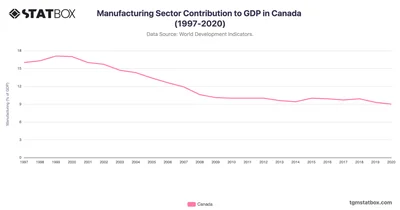
Canada’s manufacturing sector's share of GDP started at 16% in 1997, peaking at 17.1% in 1999. See more manufacturing sector's share of GDP data over the years on TGM StatBox.
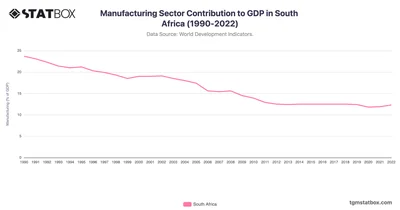
South Africa’s manufacturing sector saw a steady decline from 23.7% in 1990 to 12.3% in 2022, reflecting structural shifts and economic challenges. See more data on TGM StatBox.
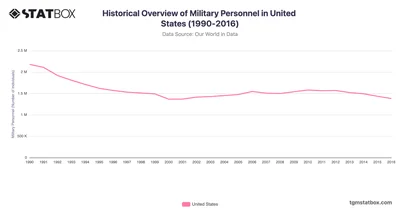
The U.S. military personnel experienced a marked decrease from 2.18 million in 1990 to 1.38 million in 2016. Discover more statistics and insights on TGM StatBox.
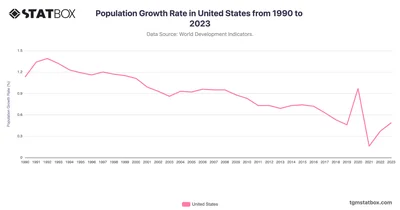
Explore the US's population trends, showcasing demographic and policy impacts. Discover more statistics and insights in your target country on TGM StatBox.
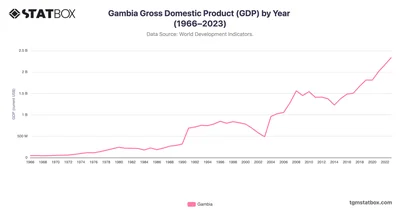
Gambia's resilience is evident as it navigated challenges, including the COVID-19 pandemic, achieving a growth rate of 5.3% in 2023. Read more on TGM StatBox.
 Pro
Pro
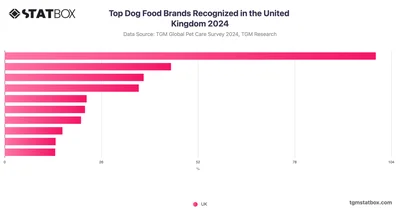
Pedigree tops the UK dog food market, with 38.39% of respondents choosing it as their favorite brand, while Harringtons and Bakers follow closely behind.
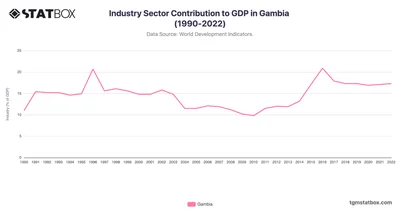
Gambia’s industry sector saw modest shifts, to a peak of 20.9% in 2016, supported by small-scale manufacturing and so on. Find more data on TGM StatBox.
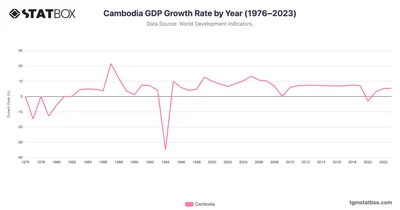
Despite challenges like the COVID-19 pandemic, Cambodia's economy shows resilience with a growth rate of 5.4% in 2023 and promising future prospects. Read more on TGM StatBox.
 Pro
Pro
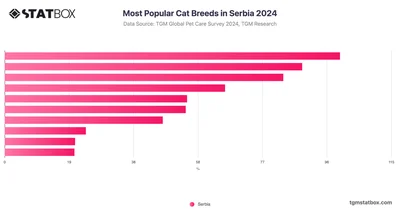
The Maine Coon is the leading cat breeds in Serbia, accounting for 15.61% of the responses. Following closely are the Persian breed at 13.85% and the Domestic cat at 12.97%.
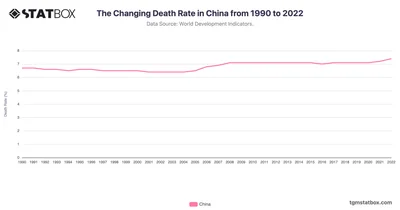
China’s death rate reflects healthcare growth and demographic transformations over decades. Discover more statistics and insights on TGM StatBox.
 Pro
Pro
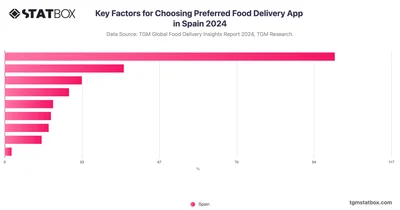
Trust in the brand name is the most important factor when people choose food delivery apps. Spanish users also prefer apps with fast order processing and competitive pricing.
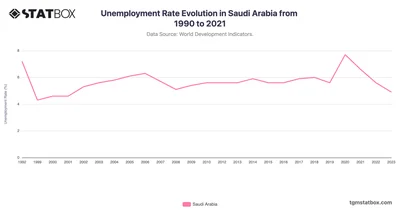
By 2023, Saudi Arabia made significant progress in reducing unemployment rate to 4.9%. Discover more Saudi Arabia's statistics and insights on TGM StatBox.
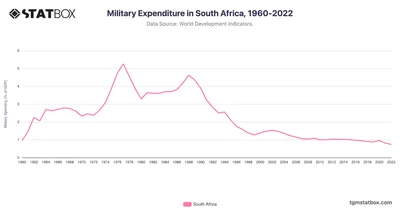
South Africa's defense spending declined to 0.7% in 2022, emphasizing recovery. Discover more statistics and insights on TGM StatBox.
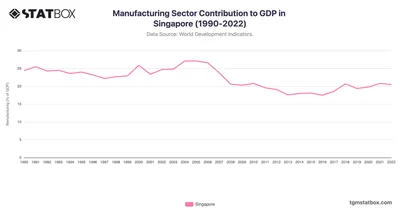
Singapore’s manufacturing sector has remained a critical part of its economy, holding steady around 20% of GDP since 2018. See more Singapore’s GDP data on TGM StatBox.
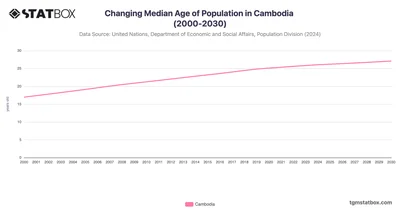
Cambodia's median age has steadily increased from 17.0 in 2000 to a projected 27.1 by 2030. Discover more about median age in Cambodia on TGM StatBox.
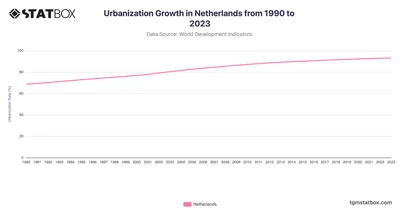
The Netherlands saw a consistent increase in urbanization from 68.7% in 1990 to 93.2% in 2023. Discover the full Netherlands' urbanization growth rate data at TGM StatBox.
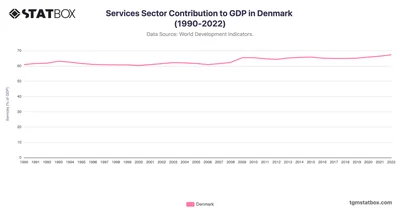
Denmark’s services sector has shown sustained growth, with its GDP contribution rising from 60.9% in 1990 to 67.3% in 2022. Find more Denmark’s GDP data on TGM StatBox.
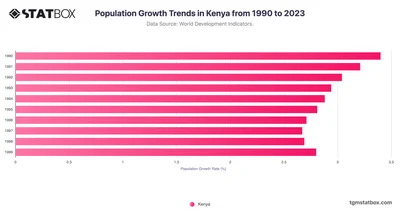
The "Population Growth Trends in Kenya 1990-2023" chart illustrates a dynamic shift in demographic growth patterns influenced by economic, social, healthcare factors.
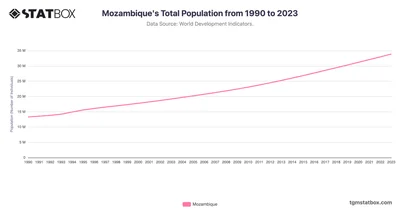
From 1990 to 2023, Mozambique has experienced significant population growth, rising to around 33.9 million. Learn more about Mozambique's population changes on TGM StatBox.
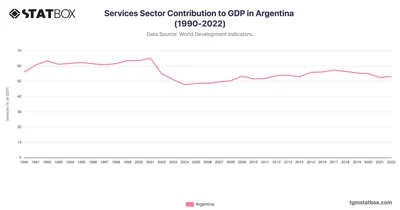
Argentina’s services sector peaked at 65.1% of GDP in 2001, supported by economic liberalization efforts in the 1990s. Find more Argentina’s data on TGM StatBox.
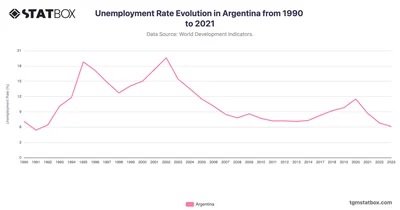
Argentina's unemployment rate exhibited notable fluctuations from 1990 to 2021, reflecting the nation's turbulent economic landscape. Discover more data on TGM StatBox.
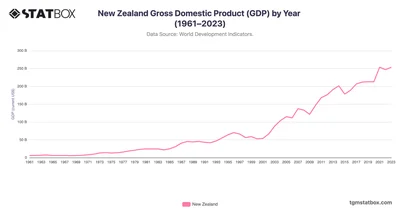
New Zealand's GDP reflects its transition from an agriculture-based economy to a diversified modern market. Learn more about New Zealand’s GDP on TGM StatBox.
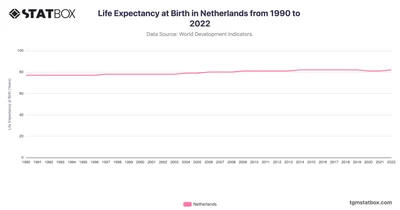
The Netherlands’ life expectancy grew from 77 in 1990 to 82 in 2022, driven by advanced healthcare systems. Discover more statistics and insights on TGM StatBox.
 Pro
Pro
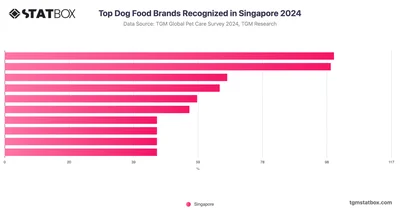
The top three pet food brands that Singaporean owners typically feed their dogs are Royal Canin (15.33%), Pedigree (15.18%), and Absolute Mild.
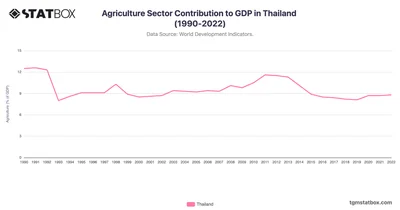
Discover Thailand's fluctuating agriculture GDP and its vital role in rural employment, especially during economic crises. Discover the full data at TGM StatBox.
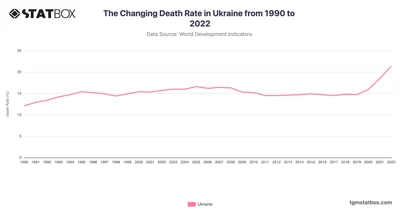
Ukraine’s death rate showcases impacts of demographic shifts and historical challenges. Discover more statistics and insights on TGM StatBox.
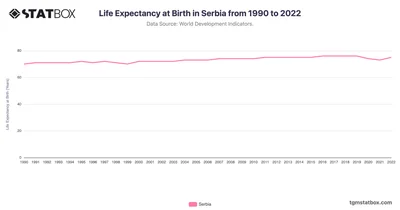
Serbia’s life expectancy grew from 70 in 1990 to 75 in 2022, reflecting post-conflict recovery and reforms. Discover more statistics and insights on TGM StatBox.
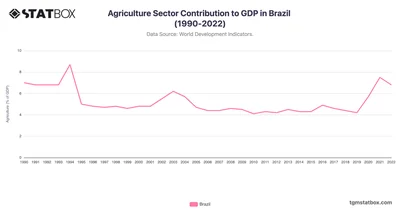
Discover Brazil’s agriculture GDP trends, essential for exports amid industry growth. Discover the full Brazil’s agriculture GDP data at TGM StatBox.
 Pro
Pro
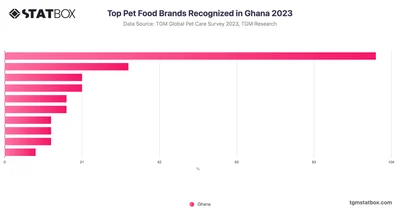
In Ghana, homemade pet food leads as the top choice among pet owners, with 24% preferring this option over commercial brands. Royal Canin is the most popular branded pet food.






