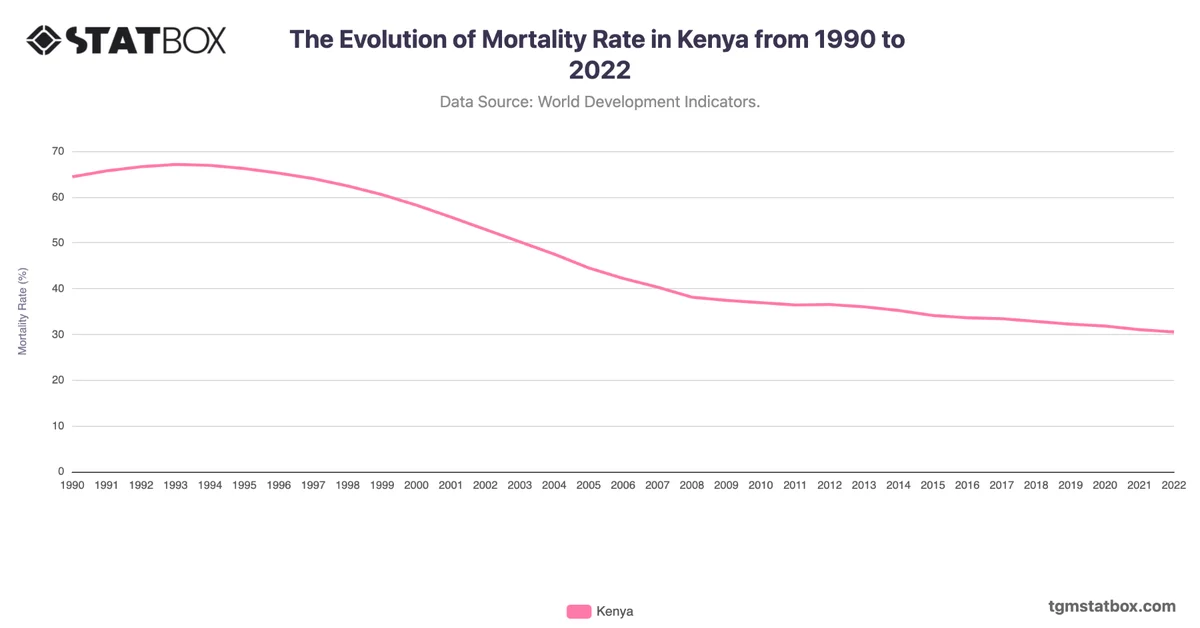
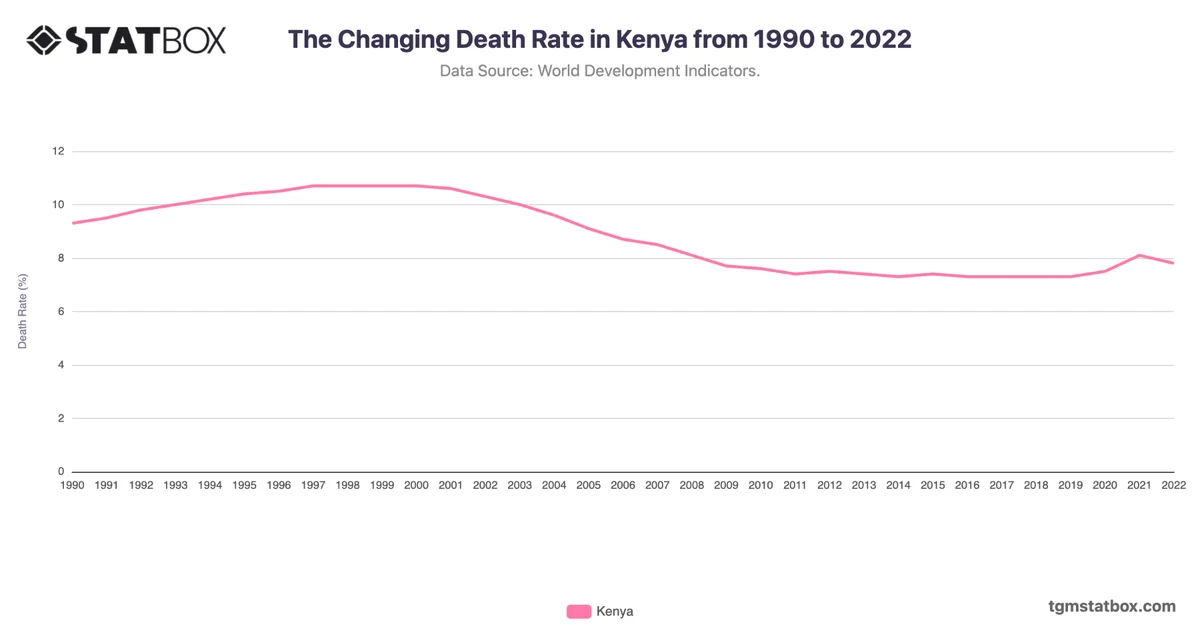
The "Population Growth Trends in Kenya from 1990 to 2023" chart illustrates a dynamic shift in demographic growth patterns influenced by economic, social, and healthcare factors.
In the early 1990s, Kenya’s growth rate began high, at 3.4% in 1990, but experienced a rapid decline, reaching 2.7% by 1996. This period reflects the initial effects of rising awareness of family planning and a shift toward smaller family sizes as urbanization increased and more people gained access to family planning resources.
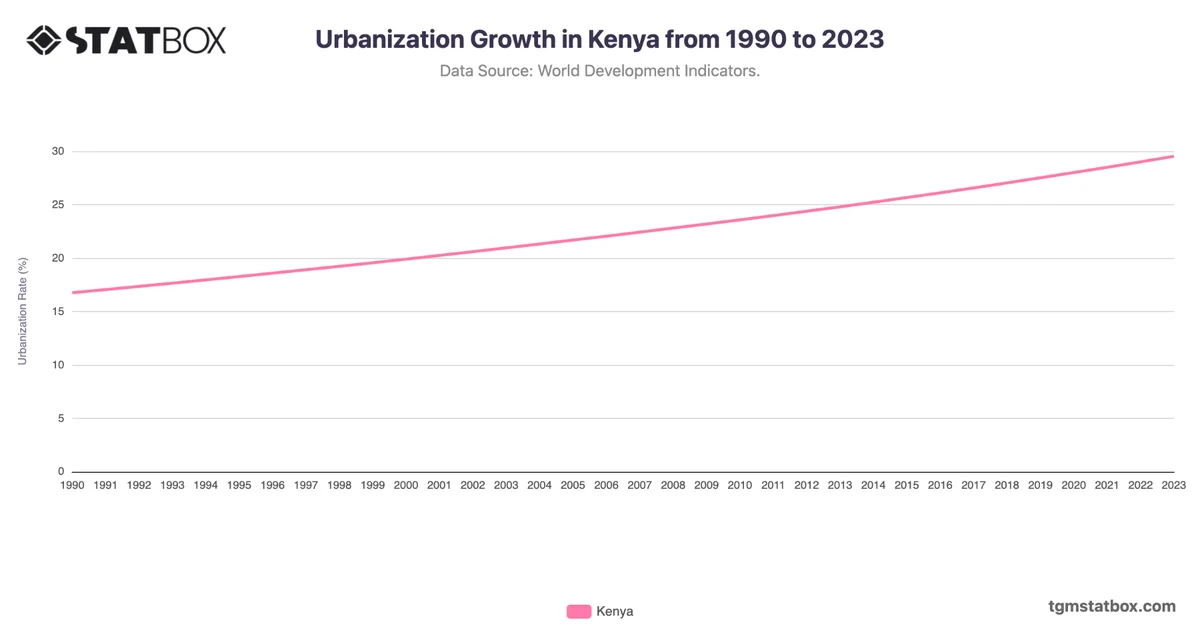
The late 1990s through 2009 marked a phase of stabilization, with growth rates maintaining a steady average around 3.0%. Improved healthcare helped sustain lower mortality rates, while fertility rates remained high. However, economic challenges moderated this stability, as employment and urban housing constraints limited the population’s expansion in urban areas, especially among younger demographics moving to cities.
A more consistent decline began in 2010, with growth rates falling to 2.0% by 2018. This shift corresponds with better access to education, more widespread adoption of family planning, and an urban migration trend that tends to favor smaller family sizes. The period marks a shift in family dynamics and lifestyle choices, reflective of Kenya’s maturing economic and social landscape.
From 2020 to 2023, growth stabilized around 2.0%, reflecting a more balanced population growth rate as economic conditions and urbanization patterns continue to shape population dynamics, with significant future implications for workforce distribution, resource management, and infrastructure development across the country.
In the early 1990s, Kenya’s growth rate began high, at 3.4% in 1990, but experienced a rapid decline, reaching 2.7% by 1996. This period reflects the initial effects of rising awareness of family planning and a shift toward smaller family sizes as urbanization increased and more people gained access to family planning resources.
The late 1990s through 2009 marked a phase of stabilization, with growth rates maintaining a steady average around 3.0%. Improved healthcare helped sustain lower mortality rates, while fertility rates remained high. However, economic challenges moderated this stability, as employment and urban housing constraints limited the population’s expansion in urban areas, especially among younger demographics moving to cities.
A more consistent decline began in 2010, with growth rates falling to 2.0% by 2018. This shift corresponds with better access to education, more widespread adoption of family planning, and an urban migration trend that tends to favor smaller family sizes. The period marks a shift in family dynamics and lifestyle choices, reflective of Kenya’s maturing economic and social landscape.
From 2020 to 2023, growth stabilized around 2.0%, reflecting a more balanced population growth rate as economic conditions and urbanization patterns continue to shape population dynamics, with significant future implications for workforce distribution, resource management, and infrastructure development across the country.
For additional information, visit statistics on Kenya’s fertility rate, urbanization rate in Kenya, Kenya’s annual GDP growth rate.