Insights library
Explore a wide range of consumer insights and statistics across industries. Discover charts on behaviors, preferences, attitudes, and market trends to find the data most relevant to your research and decision-making.
 Pro
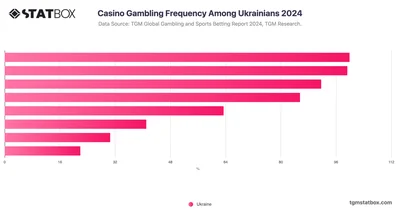
Analyze the frequency of casino gambling among Ukrainians with this TGM Statbox chart, offering data on the popularity of casino activities.
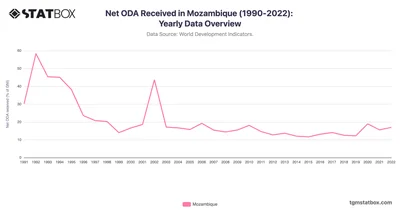
Mozambique’s Net ODA peaked at 58.4% in 1992, declining to 18.9% in 2020 during disaster recovery. Discover more statistics and insights on TGM StatBox.
 Pro
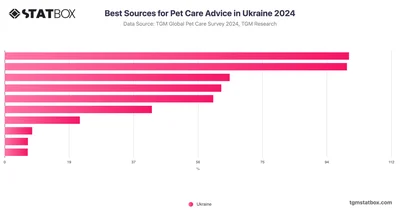
Ukrainian pet owners primarily rely on internet searches (53.4%) and veterinarians (53.1%) for pet care advice, followed by social media and pet stores.
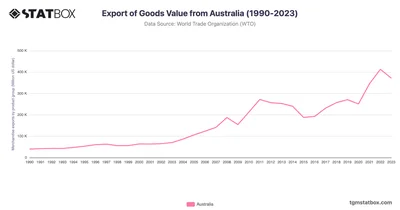
See Australia's export growth from 1990 to 2023, led by mining and agriculture sectors. Discover more statistics and insights on TGM StatBox.
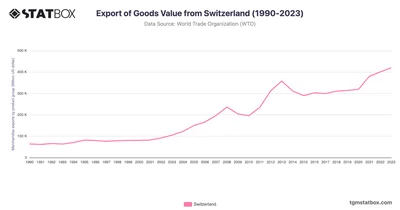
Review Switzerland's export trends from 1990 to 2023, led by pharmaceuticals and precision instruments. Discover more statistics and insights on TGM StatBox.
 Pro
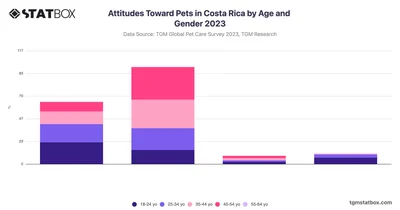
Explore attitudes toward pets in Costa Rica by age and gender, including differences across age groups and between men and women. View the data on TGM StatBox.
 Pro
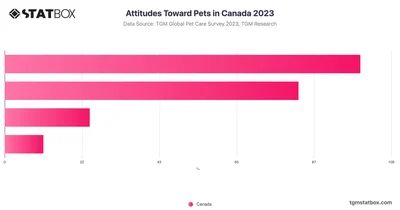
46% of Canadians express a fondness for all pets, while 38% prefer specific animals. A small minority, about 5%, indicates they do not like pets at all.
 Pro
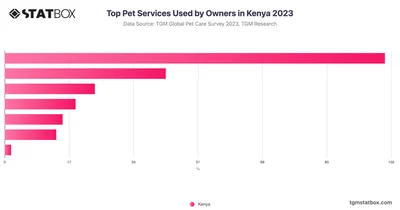
In Kenya, veterinary services are the most utilized pet service (59%), followed by pet training and grooming, with other services like pet sitting also being used.
 Pro
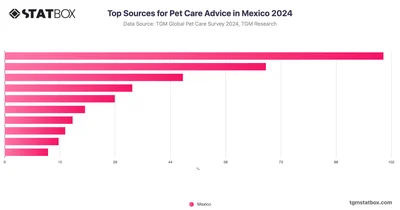
In Mexico, pet owners primarily turn to veterinarians for pet care advice, with over 68% relying on this professional source, exceeding the global average.
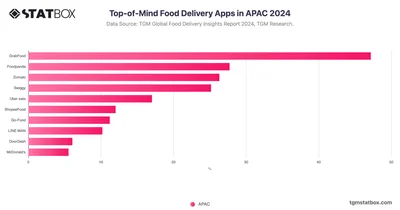
GrabFood leads in top-of-mind awareness in APAC, followed by Foodpanda, Zomato, and Swiggy, with local favorites like ShopeeFood and Go-Food adding variety.
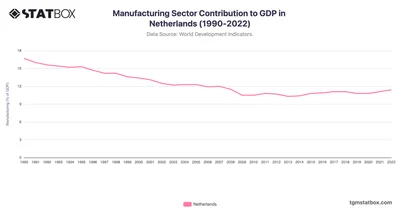
The Netherlands’ manufacturing sector has seen a gradual decline from 16.7% in 1990 to around 10-11% in the 2010s. See more Netherlands GDP data on TGM StatBox.
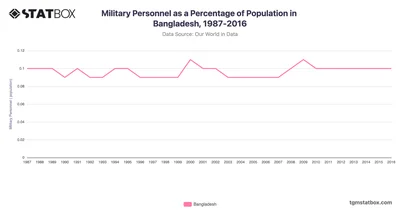
In Bangladesh, the military personnel as a percentage of the population remained consistently low and stable from 1987 to 2016. Check full data on TGM StatBox.
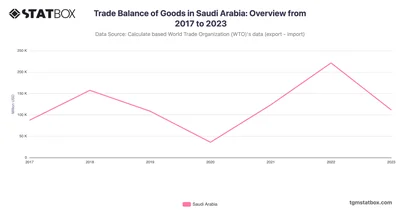
Saudi Arabia’s trade surplus narrowed in 2023, reflecting lower oil prices but steady non-oil export growth. Discover more statistics and insights on TGM StatBox.
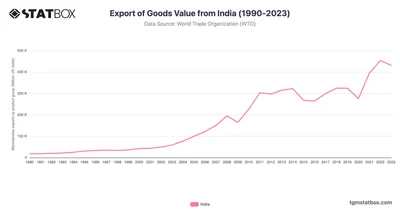
See India's export journey from 1990 to 2023, led by textiles, IT services, and manufacturing. Discover more statistics and insights on TGM StatBox.
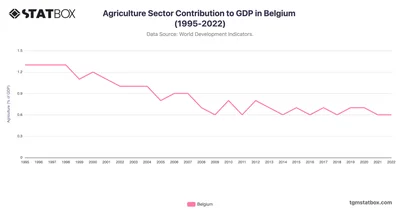
Belgium’s agriculture GDP remains minimal, balancing exports amid service growth. Discover the full Belgium’s agriculture GDP data at TGM StatBox.
 Pro
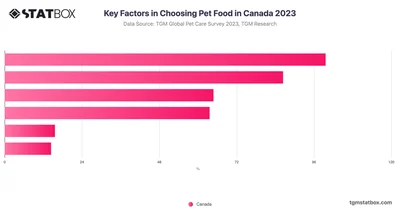
The top three factors influencing pet food purchases of Canadian are quality, price, and addressing specific needs or health concerns of pets.
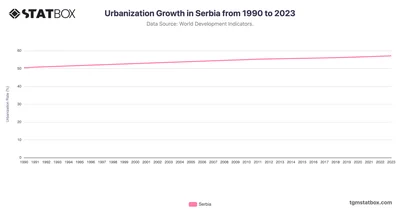
In Serbia, urbanization grew gradually from 50.4% in 1990 to 57.1% in 2023, highlighting a steady rural-to-urban migration influenced by social and economic factors.
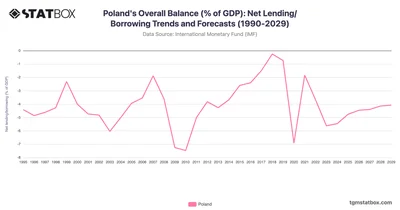
Poland’s fiscal trends show resilience, with moderate deficits projected post-pandemic. Discover more statistics and insights on TGM StatBox.
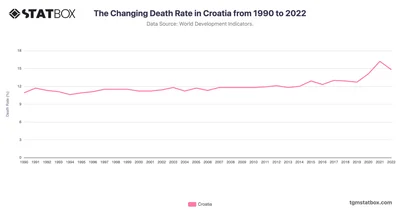
Croatia’s death rate reflects healthcare progress amid demographic transitions. Discover more statistics and insights on TGM StatBox.
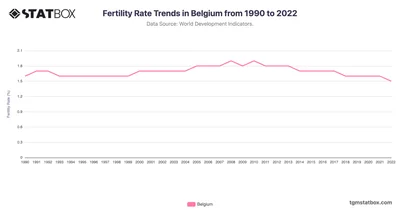
Analyze Belgium's fertility rates from 1990 to 2022, reflecting shifts influenced by socio-economic factors. Discover more statistics and insights on TGM StatBox.
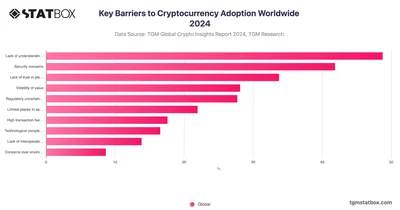
Lack of understanding is the biggest barrier to cryptocurrency adoption worldwide, with 48.8% of people citing it over concerns like security, regulation, and volatility.
 Pro
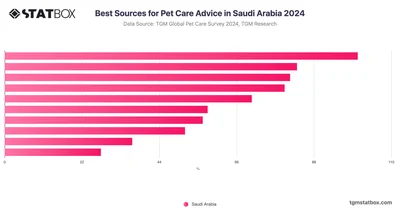
In Saudi Arabia, veterinarians (45.6%) are the most popular source of pet care information, followed by social media and the Internet.
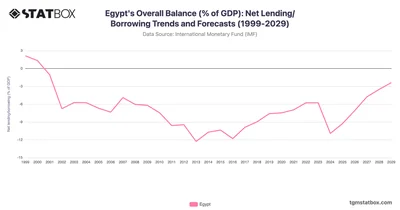
Egypt’s persistent deficits reflect structural challenges, with gradual improvement projected. Discover more statistics and insights on TGM StatBox.
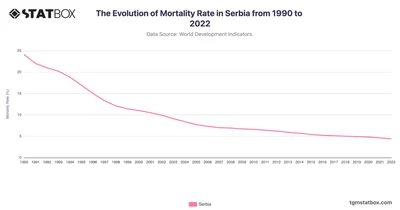
Serbia’s mortality rate fell from 24.1 in 1990 to 4.4 in 2022, reflecting healthcare improvements despite challenges. Discover more statistics on TGM StatBox.
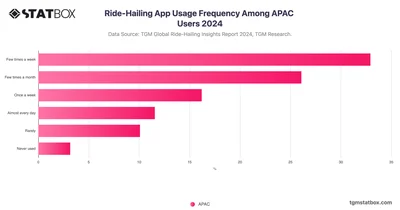
In the APAC region, a significant 54.9% of users rely on ride-hailing apps frequently, using them almost every day, few times a week, or once a week.
 Pro
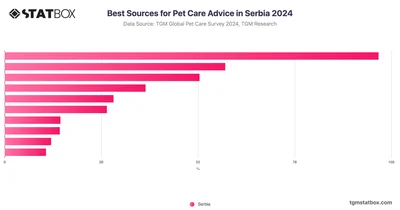
The most trusted source for pet care advice in Serbia is veterinarians, with a significant 77.36% of pet owners relying on their expertise for guidance.
 Pro
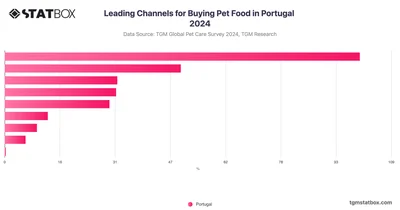
The primary channel for purchasing pet food is supermarkets, with a significant 64.3% of pet owners opting for this convenient option. Independent pet stores or small chains follow.
 Pro
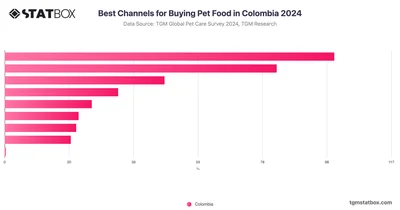
Colombian pet owners show diverse preferences for purchasing pet food, with supermarkets being the most popular channel, used by 51.15% of respondents.
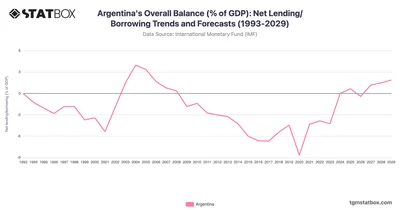
Argentina’s deficits reflect debt challenges and recovery efforts, with gradual improvement expected. Discover more statistics and insights on TGM StatBox.
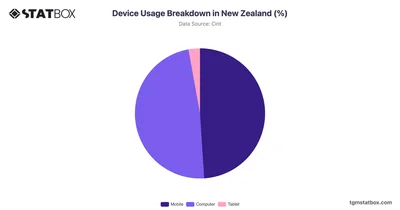
Explore device usage breakdown in New Zealand, showcasing percentage distribution of smartphones, tablets, desktops. Analyze the trends shaping digital habits.