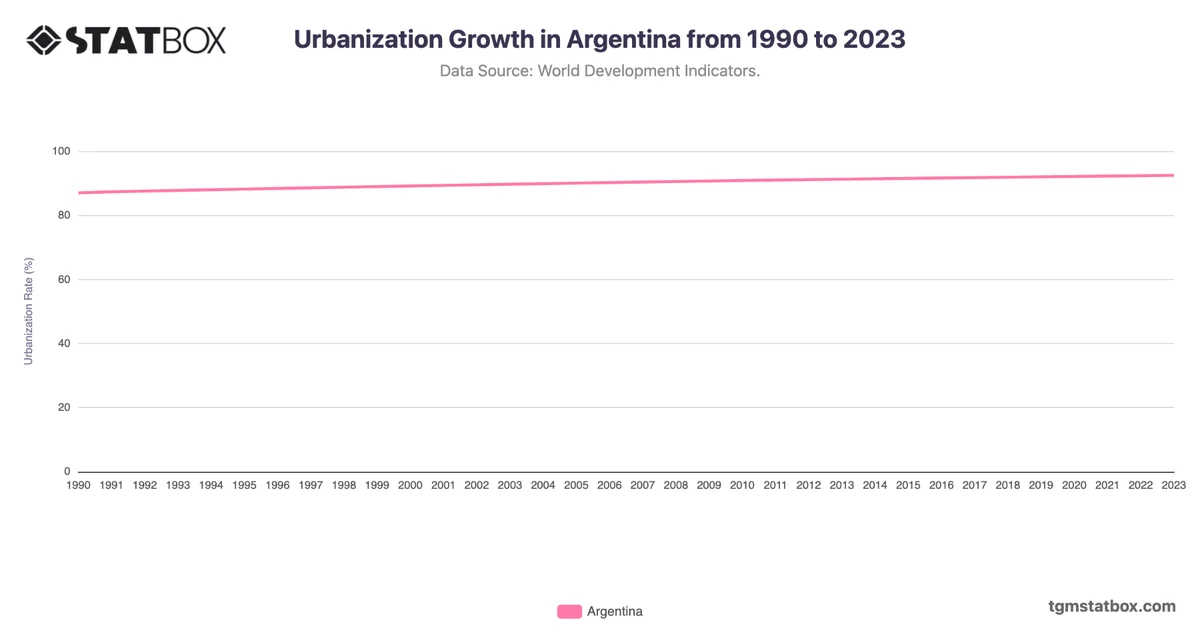
From 1987 to 2016, Argentina saw a consistent decline in military personnel as a percentage of its population, starting at 0.4% in 1987 and stabilizing at 0.2% from 1991 onward. This decline corresponds with Argentina’s shift toward a more civilian-focused government following its return to democracy in 1983, which likely influenced military downsizing and redirected focus toward economic development. Urbanization played a significant role, as the Argentine population increasingly concentrated in cities, emphasizing infrastructure and social services over military spending.
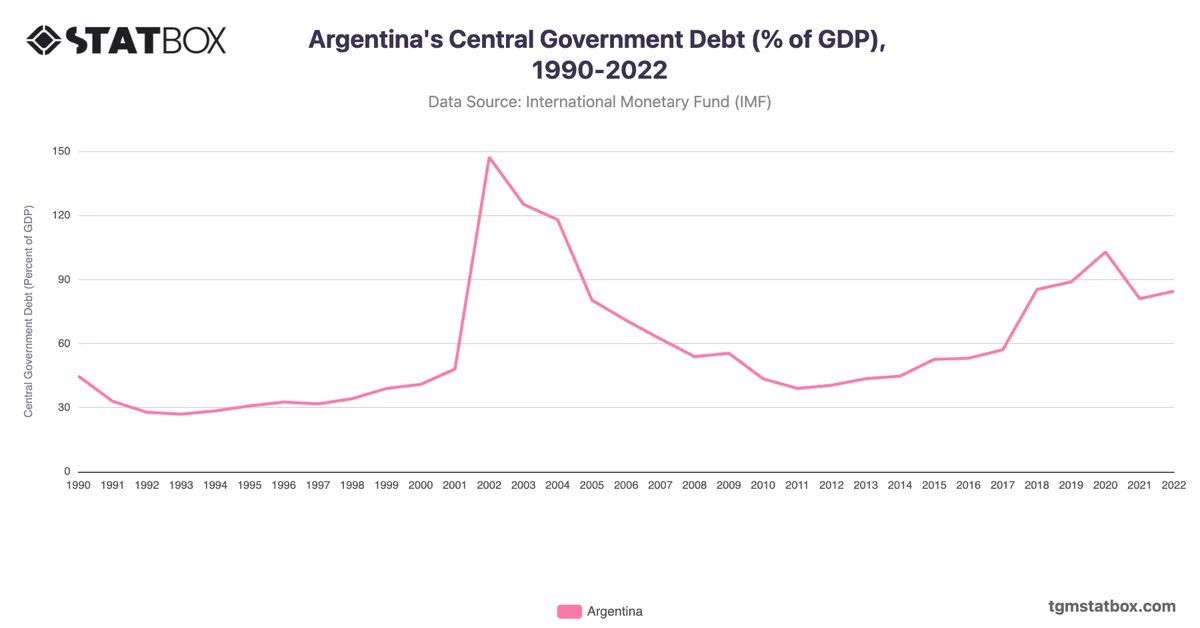
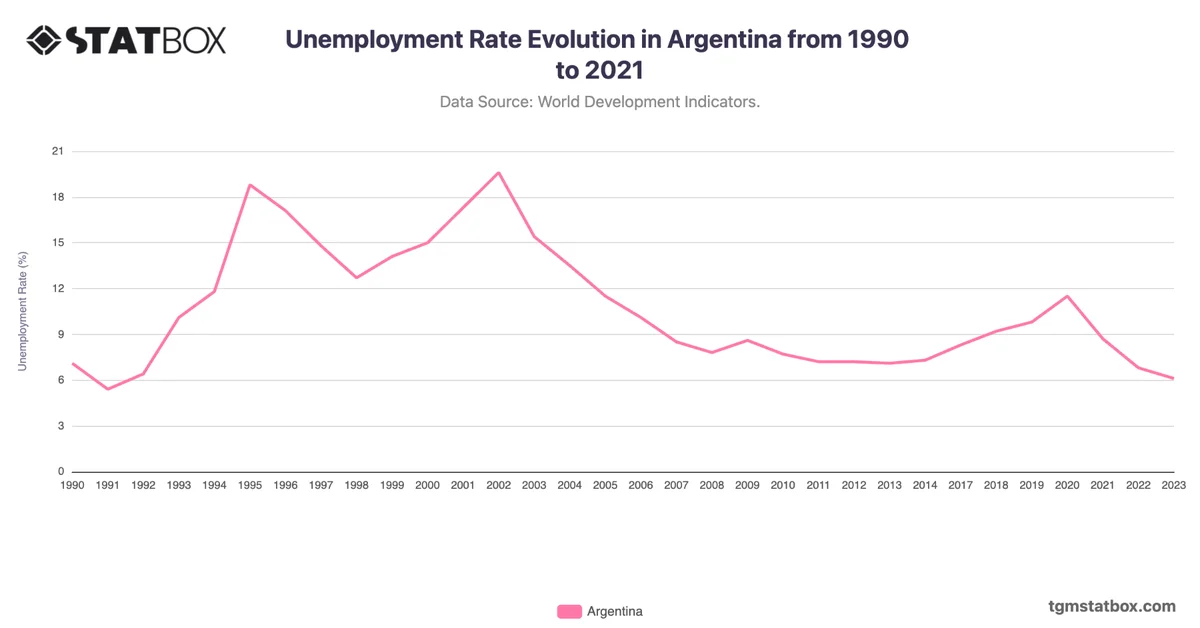
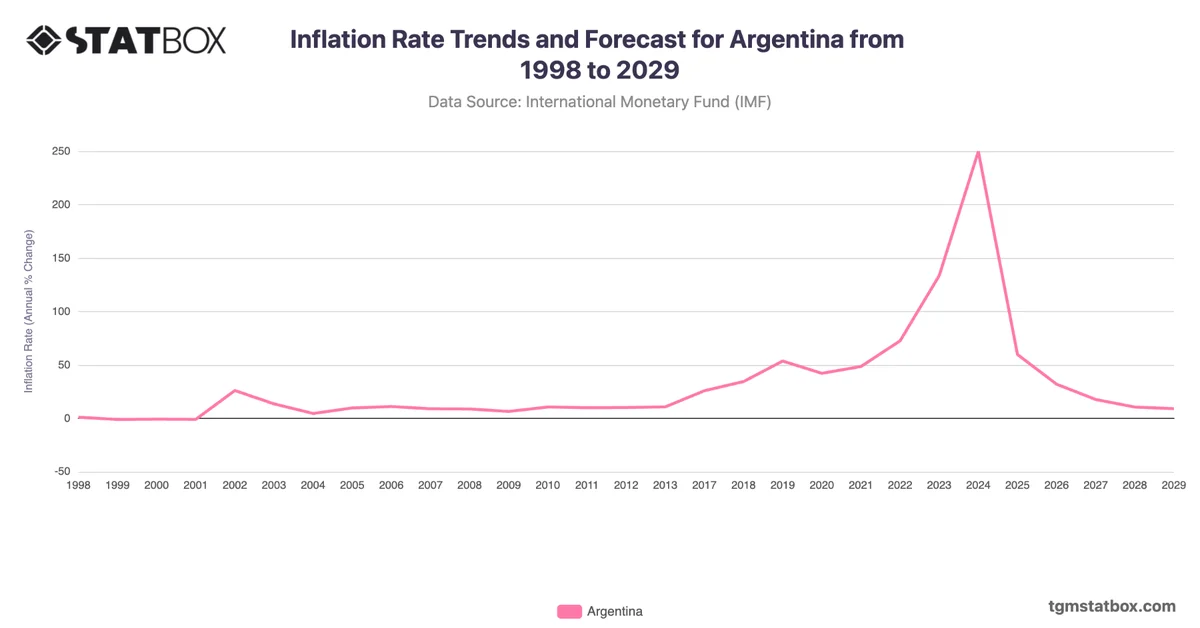
The stabilization at 0.2% from 1991 highlights a period where Argentina maintained minimal military staffing relative to its population. Economic challenges in the late 20th century, including inflation and the 2001 financial crisis, further directed government priorities toward social programs rather than expanding the military. This consistent percentage reflects Argentina's strategic focus on maintaining a small, sustainable military force, aligning with its relatively stable position in South America and its limited involvement in regional conflicts.
The stabilization at 0.2% from 1991 highlights a period where Argentina maintained minimal military staffing relative to its population. Economic challenges in the late 20th century, including inflation and the 2001 financial crisis, further directed government priorities toward social programs rather than expanding the military. This consistent percentage reflects Argentina's strategic focus on maintaining a small, sustainable military force, aligning with its relatively stable position in South America and its limited involvement in regional conflicts.
Discover additional trends and data on Argentina’s defense spending, Argentina’s urbanization rate, Argentina’s population growth trends.