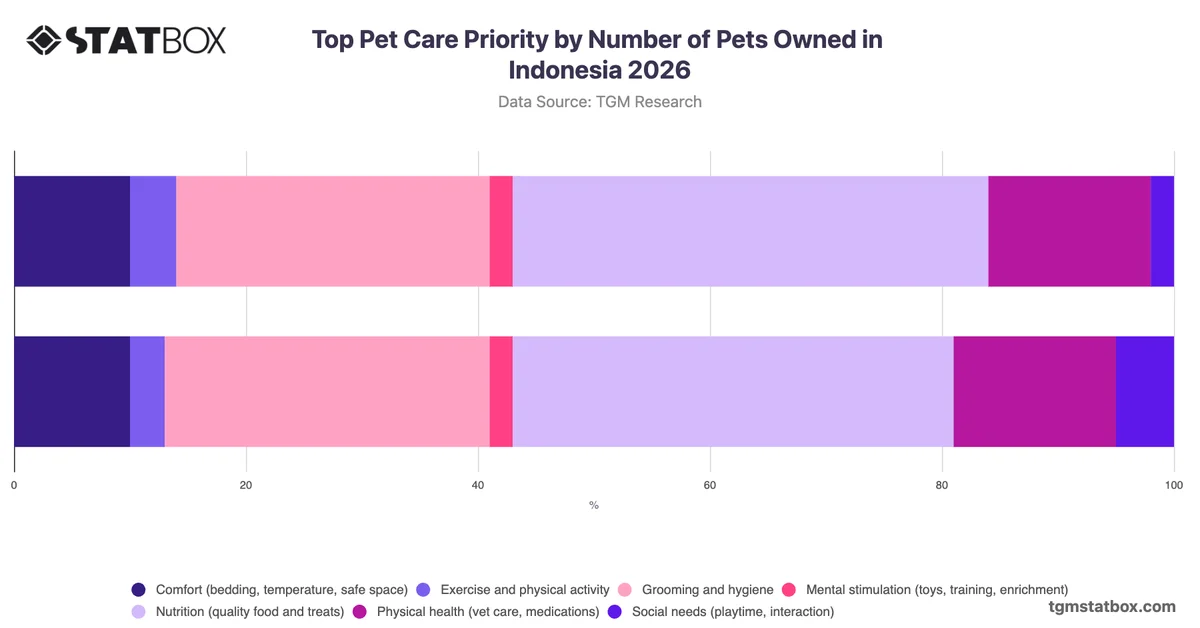
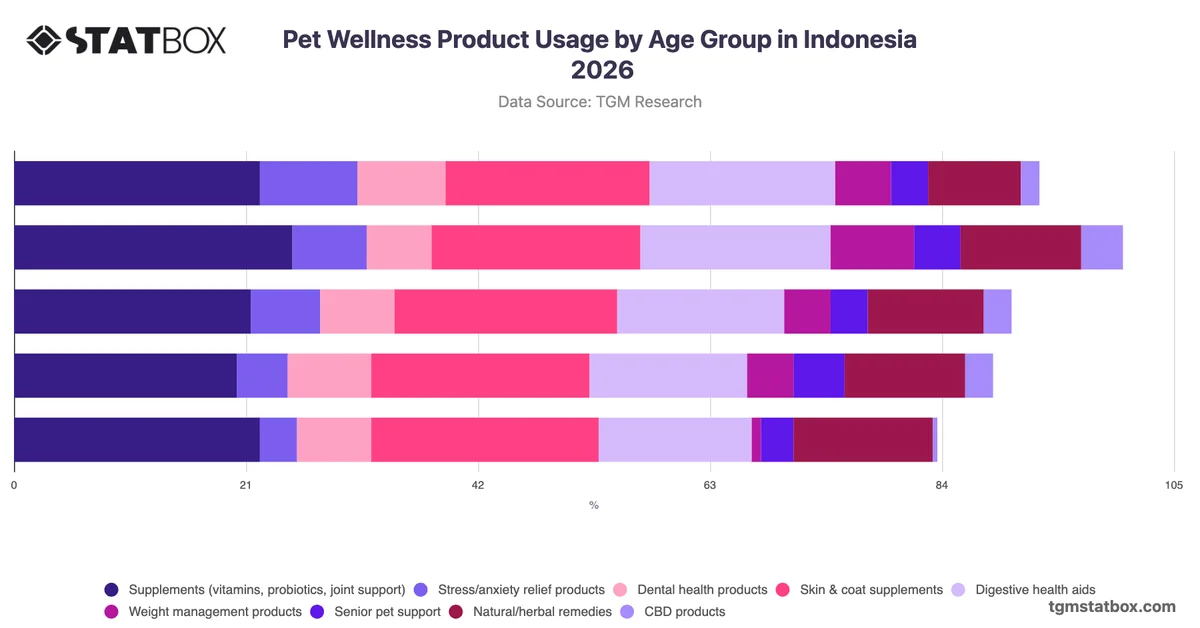
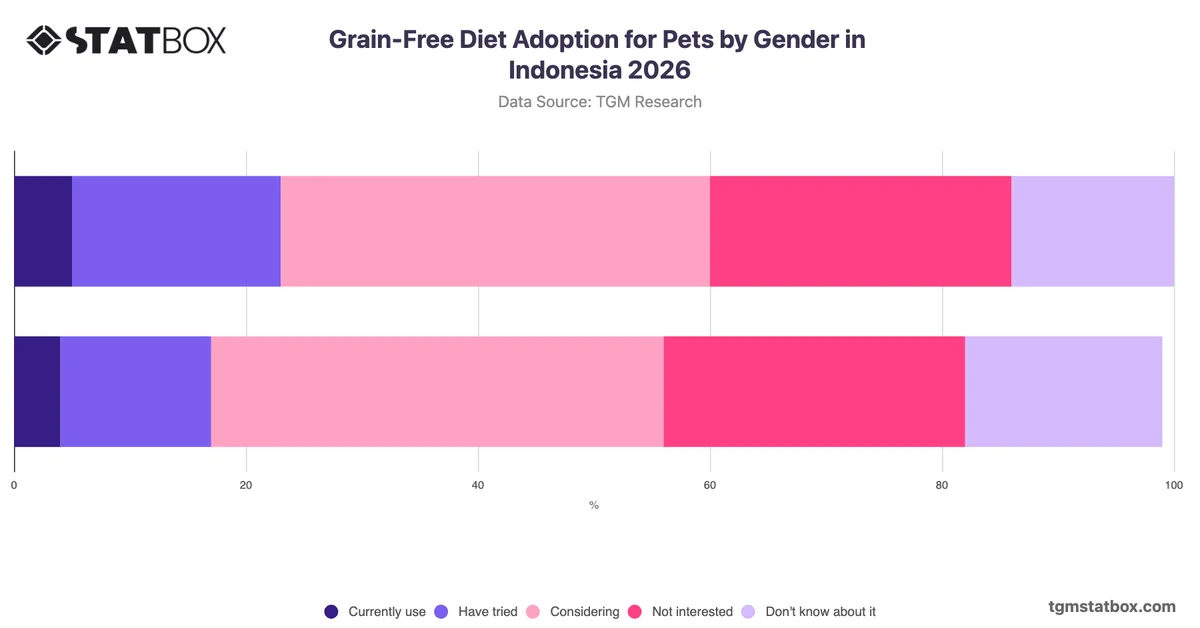
Chart

Attitudes Toward Pets' Importance in China 2026

Attitudes Toward Pets' Importance in China 2026

Share the statistic on social media channels or embed the statistic in your website using "Embed Code", where available.

Share chart

Embed chart
Select Citation

Cite this statistic and select one of the following formats: APA, Chicago, Harvard, MLA & Bluebook


  • APA
  • Chicago
  • Harvard
  • MLA
  • Bluebook
  • IEEE
TGM StatBox. (2026). Attitudes Toward Pets' Importance in China 2026. TGM StatBox.
Score
  • Strongly agree (Score: 5)
  • Agree (Score: 4)
  • Neither agree nor disagree or Neutral (Score: 3)
  • Disagree (Score: 2)
  • Strongly disagree (Score: 1)
Insights

Key Takeaways

Strength of Pet Attachment Among Chinese Consumers

The role of pets within household and social life spans practical companionship, emotional wellbeing, and broader lifestyle identity. In markets where pet ownership intersects with consumer spending decisions, understanding the depth of personal attachment to animals is a foundational consideration for category positioning, product development, and communication strategy.

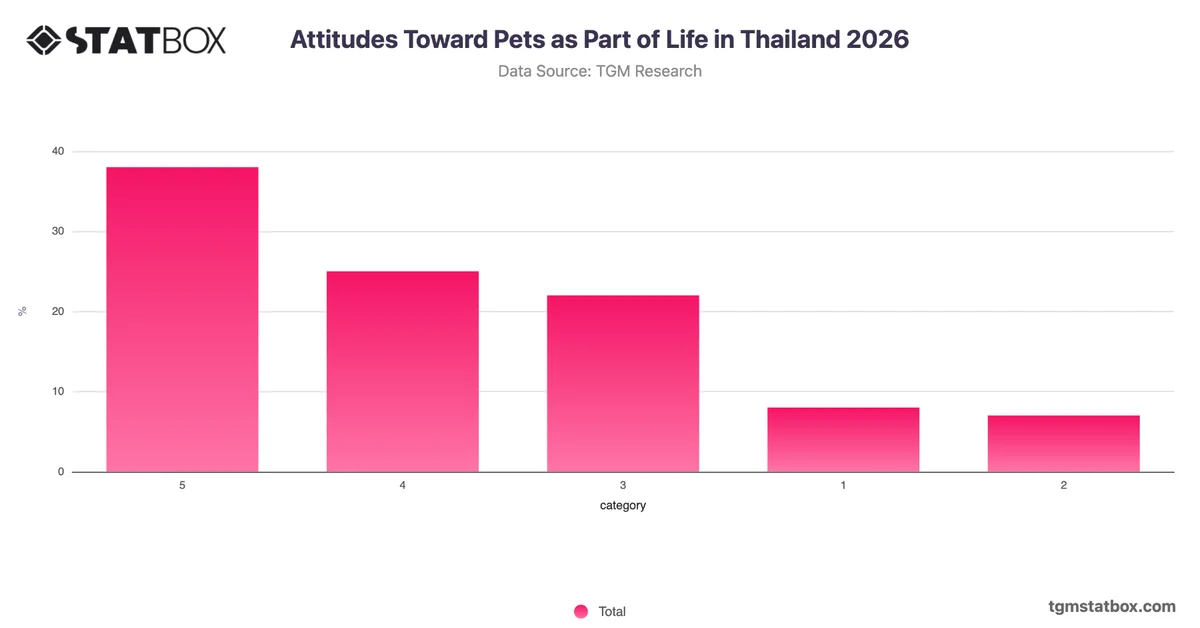
Attitudes toward pets in China lean positively overall, yet the distribution points to a meaningful gap between moderate and strong agreement. Combined, the top two agreement positions account for 69% of respondents, with the strongest level of agreement at 35% slightly outpacing the next tier at 34%. However, 22% selected the midpoint, indicating that a notable segment holds a cautious or non-committal stance rather than active personal investment. Outright disagreement remains limited at 8% in total. This pattern suggests broad social acceptance of pets without uniform depth of personal attachment, a distinction that may signal different levels of purchase intent or brand engagement across the consumer base. Organisations operating in this category should consider segmenting audiences by intensity of attachment rather than treating agreement as a uniform signal, prioritising messaging that deepens emotional connection among the moderate majority.

AI-powered chart insight: This summary is automatically generated to help you understand the chart at a glance. It is intended as an overview; view the full chart and underlying data for complete context.

Related report

Would You Like to Know More?
Explore Our Pet Care Report

Charts library

Further Recommended Pet Care Statistics

Statbox vector
The briefing
New data, in your inbox

Consumer insights, data stories and product updates as we publish them. No other mail, and one click to leave.

Roughly two emails a month.

Research services
Have a question our newsroom hasn't answered? Ask it directly.

Our team can run the study behind the story — in 60+ countries, on your question, with the data belonging to you.