Share the statistic on social media channels or embed the statistic in your website using "Embed Code", where available.
Share chart
Embed chart Embed copied!Cite this statistic and select one of the following formats: APA, Chicago, Harvard, MLA & Bluebook
TGM Global Pet Care Survey 2023, TGM Research
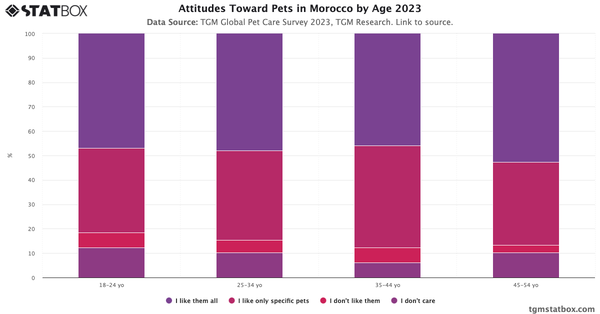
"What is your attitude towards pets?"
Key Takeaways
While 55% of Australians claim to love all pets, this universal affection doesn't necessarily translate to actual pet ownership rates. The 35% who prefer specific animals likely drive the pet industry, influencing market trends and product development. Only 4% of Australians report a dislike for pets. This low percentage highlights the overall positive attitude towards pets across the population.
For a deeper dive into the topic, explore top pet care resources, most popular pet services in Australia, most popular pets in Australia.

Pet Care Report in Australia 2024
Discover insights into Pet Care in Australia with TGM StatBox. Access our detailed report, including graphs and tables, to uncover the industry's trends.
Go to report


Connect with our expert team for immediate assistance or comprehensive market analysis. We are always ready to support your business needs.